How to Create an Entra ID Activity Summary Report from Microsoft Office 365 Admin Audit Logs
In this article, we’ll look at creating Microsoft 365 reports summarizing the various admin activities done in Entra using the data from Office 365 Admin Audit Logs, including the type of changes that were made and by whom. For example, you may want a list of every type of change made by administrators in a certain period of time. We’ll look at how to gather this information from the Microsoft 365 Admin portal and by using PowerShell. Then we’ll look at a quicker and easier PowerShell alternative, sapio365. sapio365 is a third-party tool that can save IT admins a lot of time and effort. You can read more about Office 365 audit logs here.
Parsing and collating audit log data from the Microsoft 365 portal is not easy
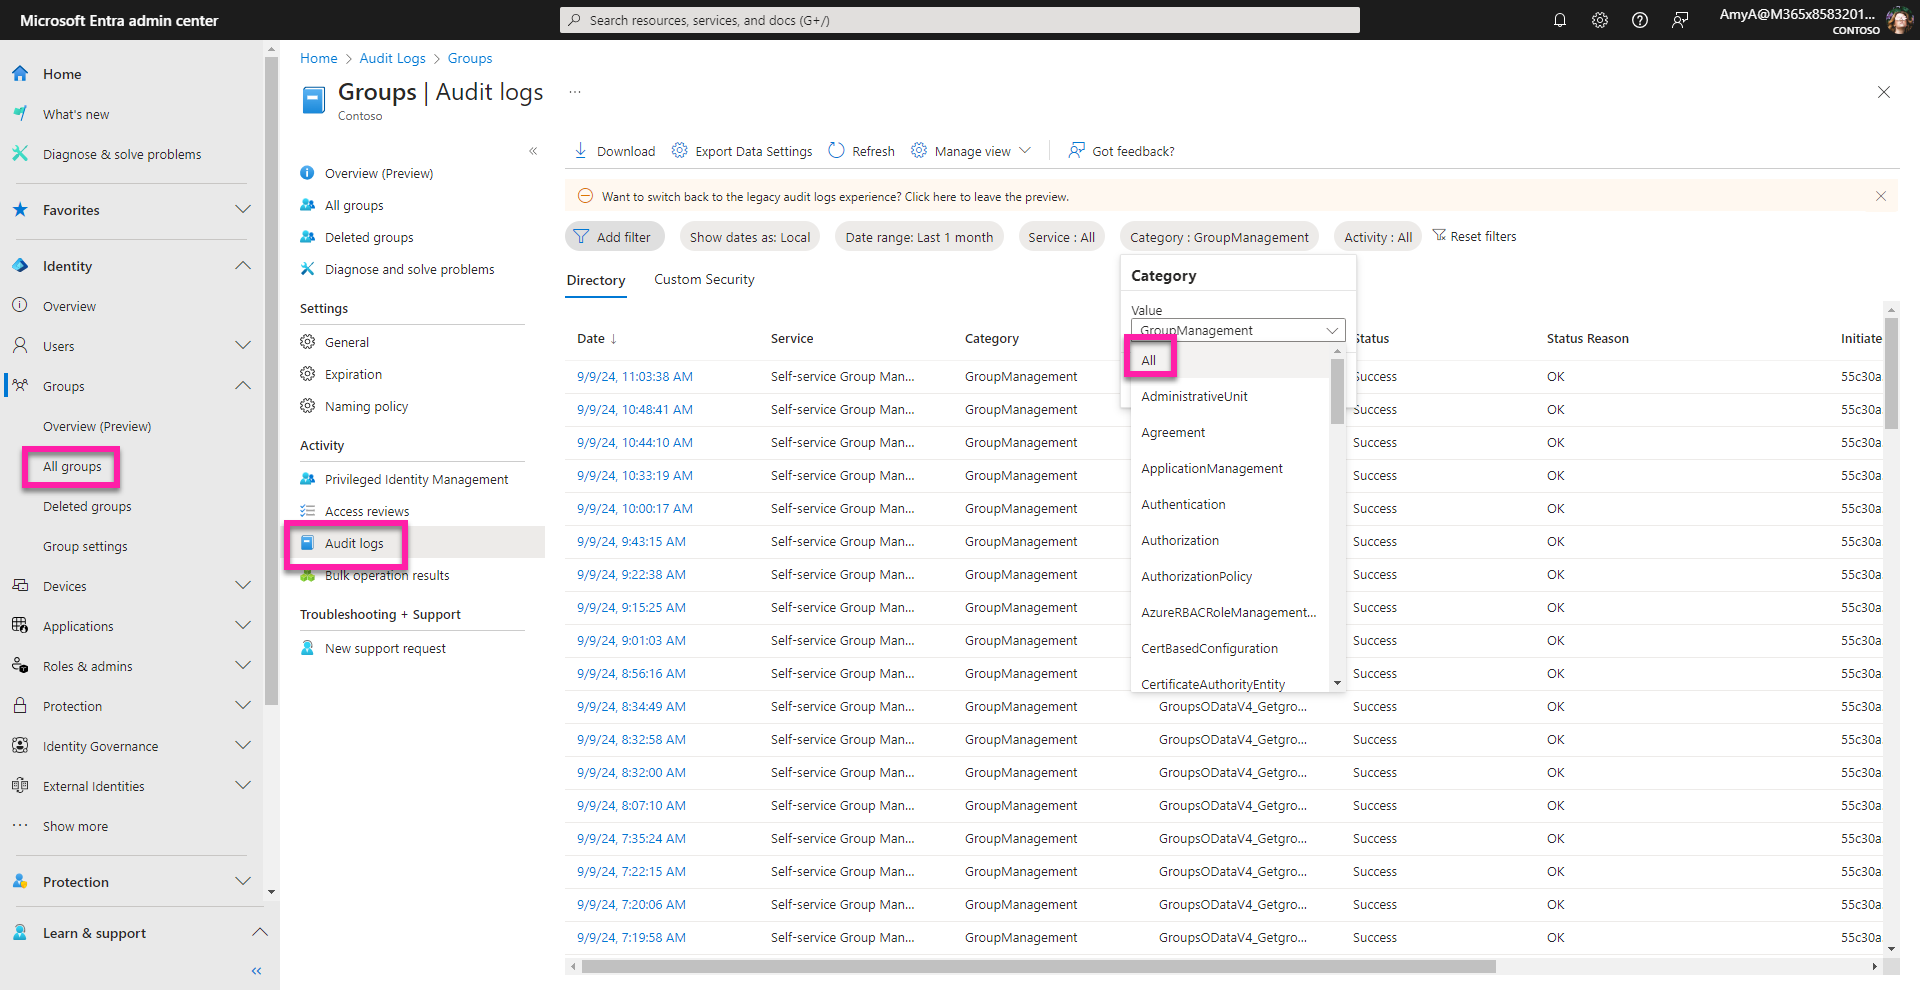
Microsoft Office 365 Admin Audit Logs can be accessed in the Entra Admin Center in various sections pertaining to Users, Groups, Devices, Applications, and Roles & Admins. By default, Admin Audit Logs are set with a category filter specific to each section, but you can remove that filter to retrieve all admin activities.
In the image below, the Office 365 Admin Audit Logs in the groups section shows that the Category filter is set to ‘GroupManagement’, which you can remove by setting it to ‘All’. You can also set the date range to limit the volume of results, especially if there is a lot of admin activity in your environment.
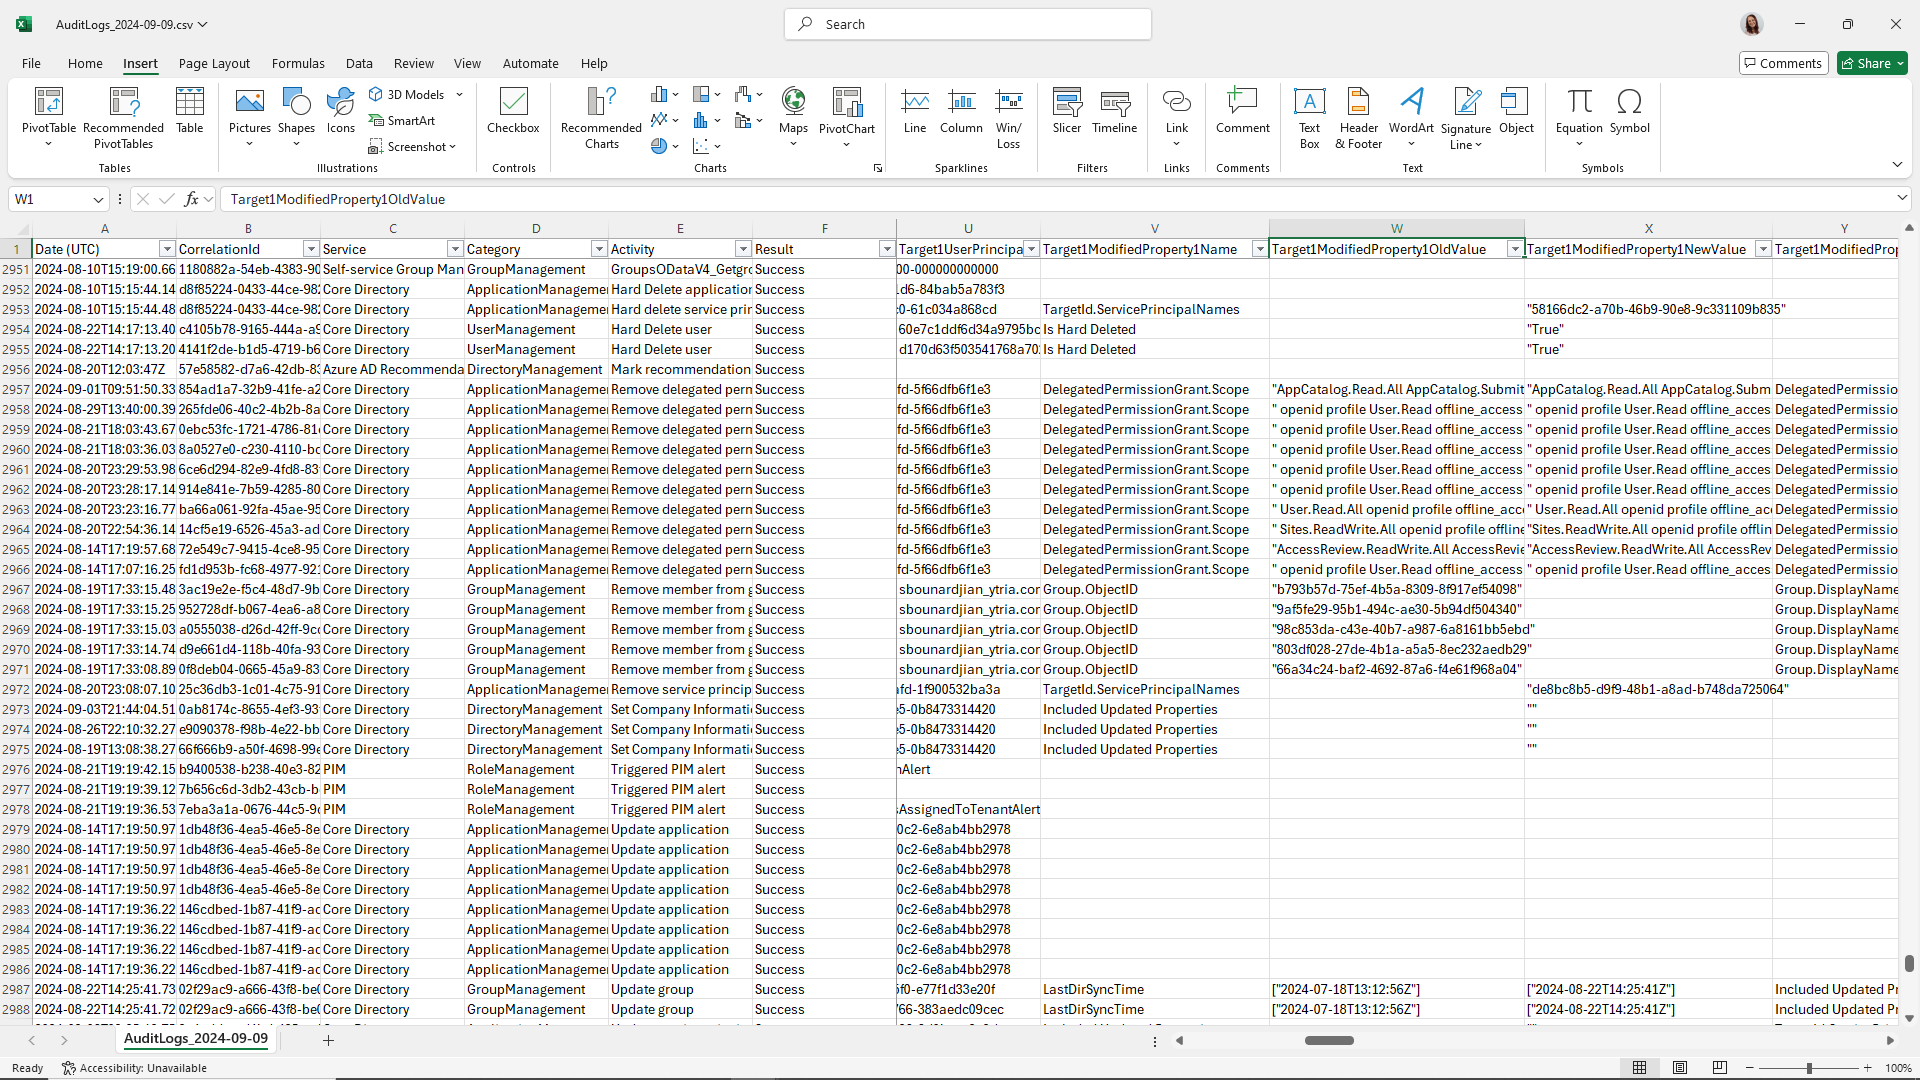
You can then download the entire data set to a CSV file (please note that you can download up to 250,000 records) to analyze it with some of the advanced tools in Excel. If you have more than 250,000 records to export, you can do so by using a Microsoft Graph API (see the section below), or you can apply a filter on the Category or the Activity name before downloading each dataset as a batch.
If you’re familiar with creating pivot tables in Excel, you can use that feature to summarize your data in addition to sorting and grouping your data.
While Excel has excellent features to analyze each activity, it requires some advanced skills to organize the data.
Alternatively, you can let sapio365 do it for you – see the last section!
Exporting Microsoft Graph API results of Microsoft Office 365 admin audit logs requires skills
To query the Microsoft Office 365 Admin Audit Logs with Microsoft Graph API use GET https://graph.microsoft.com/v1.0/auditLogs/directoryAudits. More information on this API can be found on this page.
If you’re familiar with PowerShell, you can create a script that calls this API and export the results to a CSV file.
On the other hand, if you want to save yourself the headache of writing scripts, get your Microsoft Office 365 Admin Audit Log report with sapio365 in just a few clicks (see the section that follows).
Customize your Microsoft Office 365 Admin Audit Logs report in sapio365
sapio365 is a third-party software tool that enables IT admins to perform daily tasks without using PowerShell, saving a lot of time and effort. One of the benefits of sapio365, is that it gives you a full and extensive view of all your users in one place. With this view, you can drill down into the details you need, sort and organize the information using the filters it offers. With sapio365, you can preview your data before you make any permanent changes. It allows you to save your customized views for the next time you need to run the same reports or schedule the report to run however often you want.
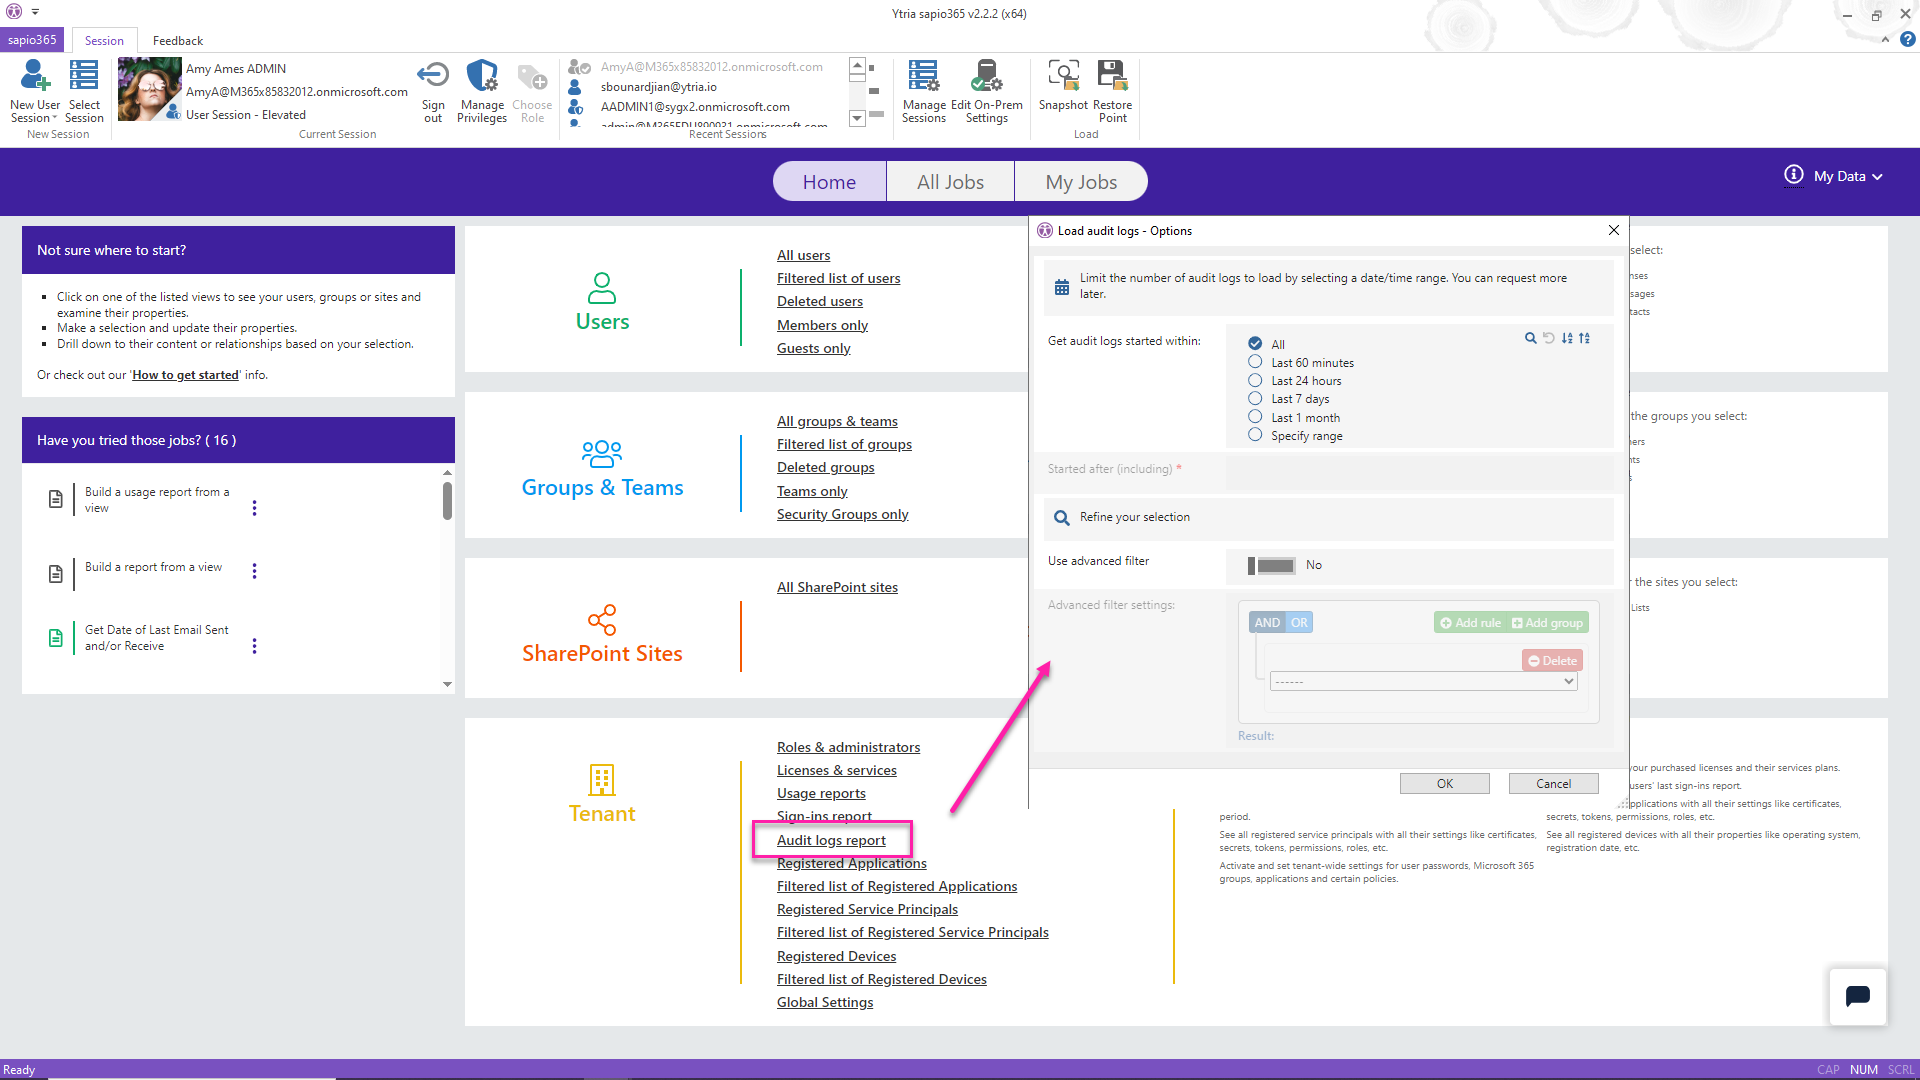
In sapio365, retrieving the entire Admin Audit Log is just a click away.
From the main window, click on Audit Logs and select a time range to limit the number of results.
Once loaded, you can add more columns like the “Old value of modified properties – Target” and “New value of modified properties – Target” from the property viewer (clipboard icon) at the top-right of the grid, or you can remove the ones you don’t need for your report. You can also sort, filter or categorize your data in whatever way you need. See the examples that follow.
View #1: List the last date for each admin activity type in Entra ID
To create a summary of each type of admin activity with the latest activity date, simply follow these steps.
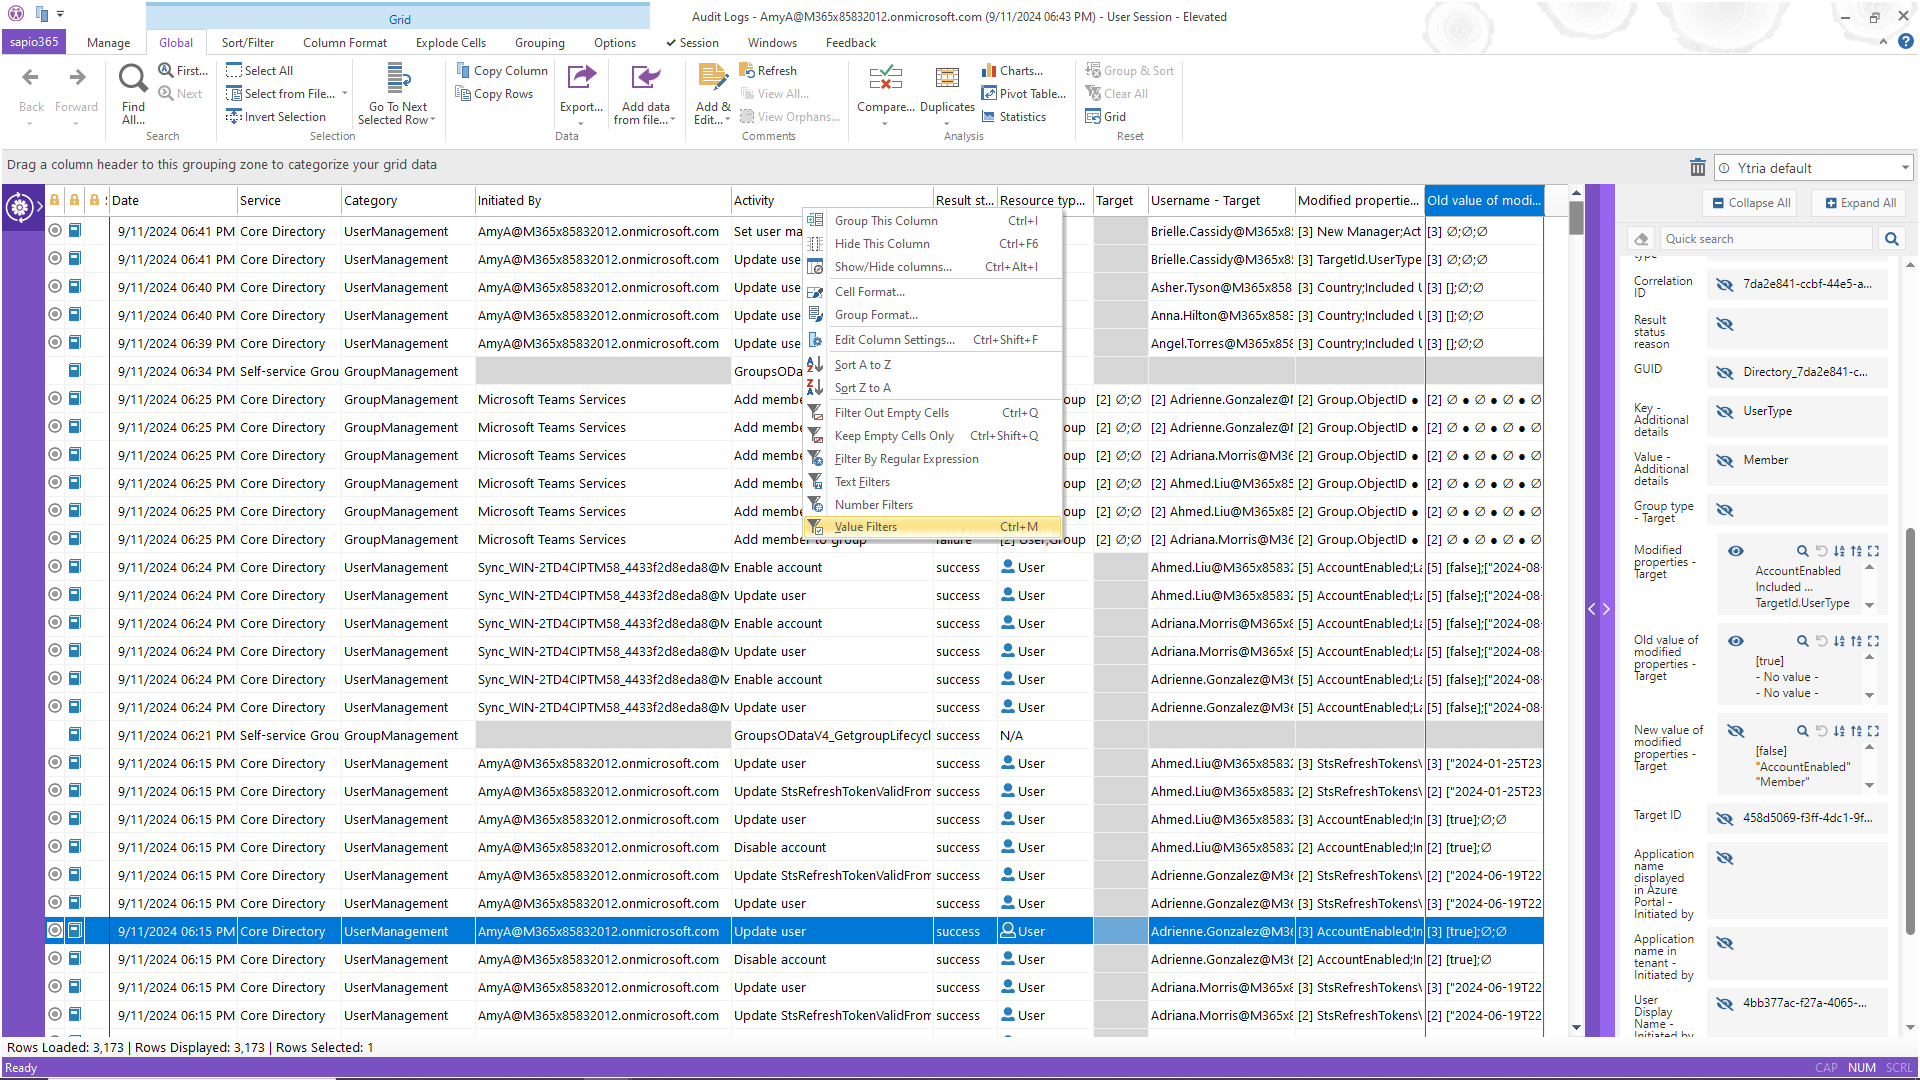
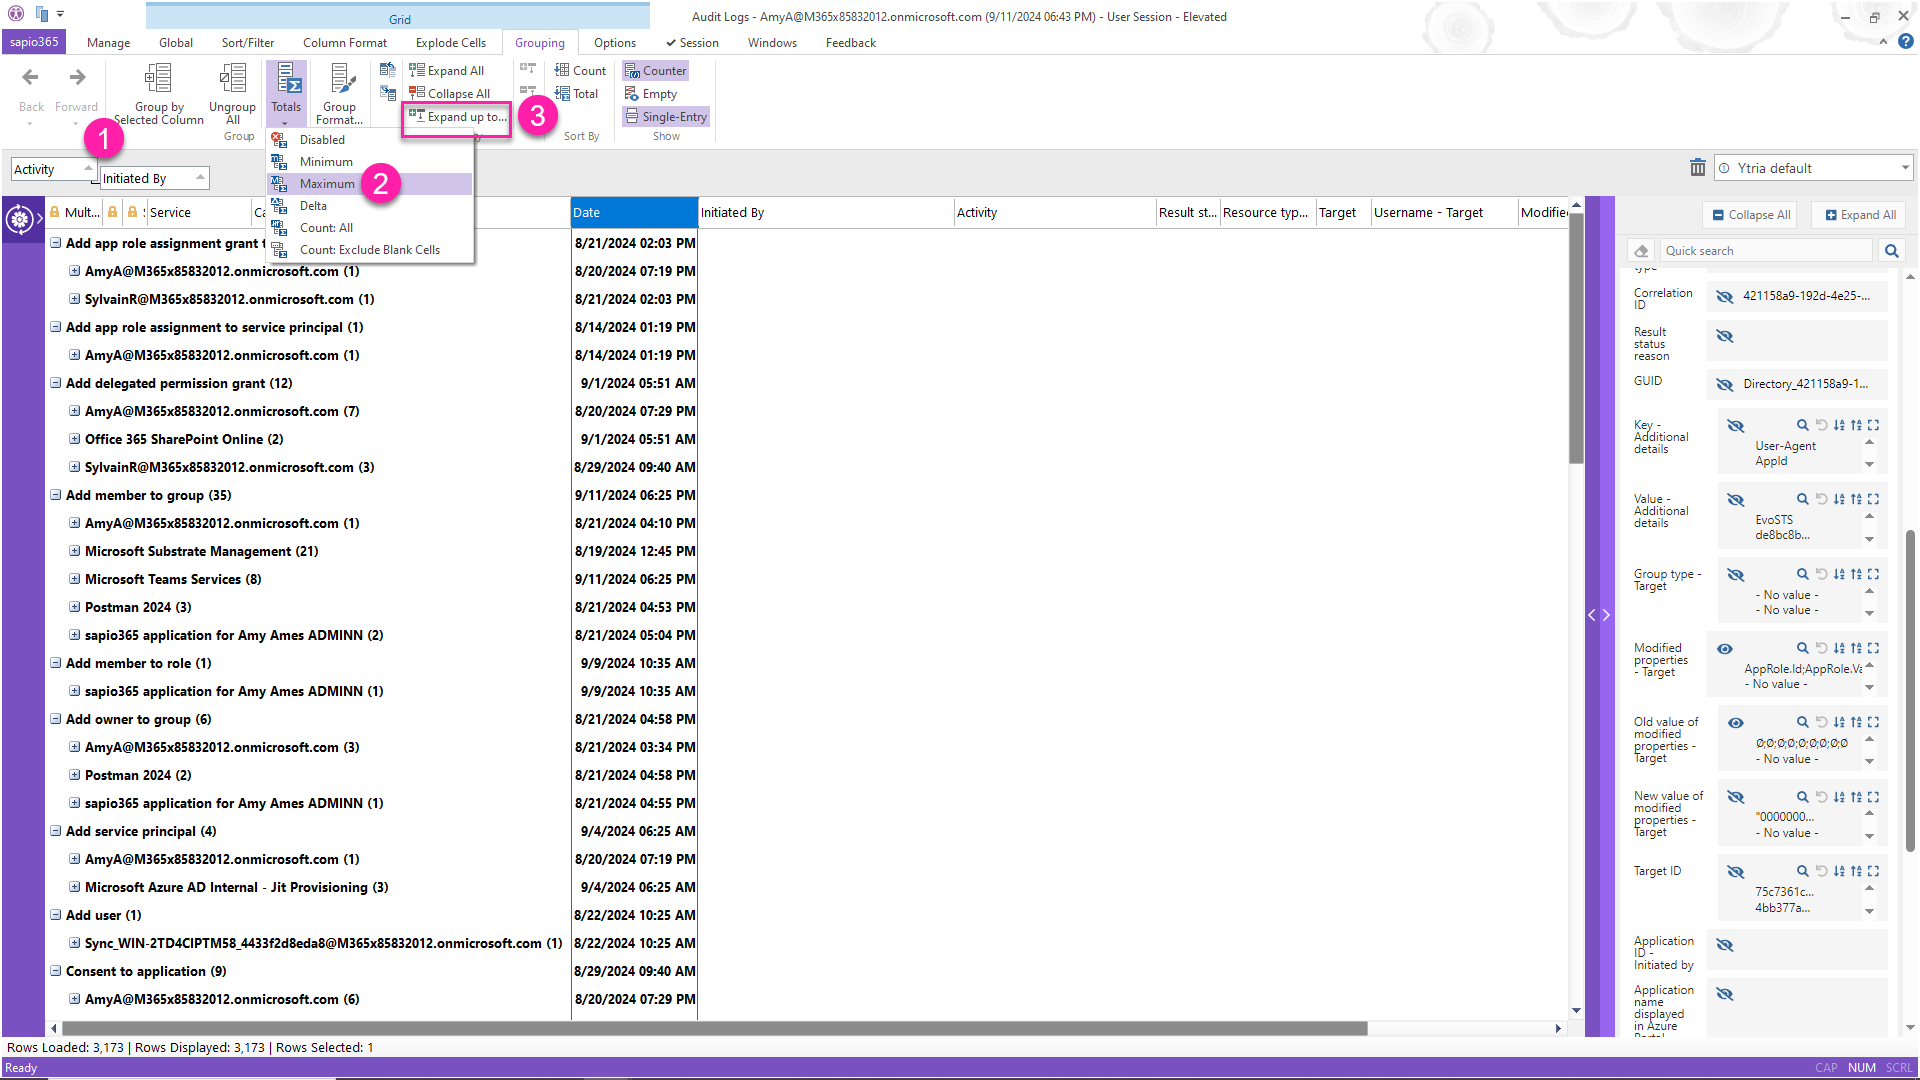
- Group by the “Activity” column and then by the “Initiated by” column by dragging their column header to the grouping zone on the left, or you can right-click on the header.
- Select a cell under the date to bring that column into focus and apply a Maximum (to get the latest date)
- Expand all groupings to Level 1.
View #2: Report changes made to user accounts by admins broken down by day
What if you want your report to include only user updates and the details about what has been updated? sapio365 makes it easy.
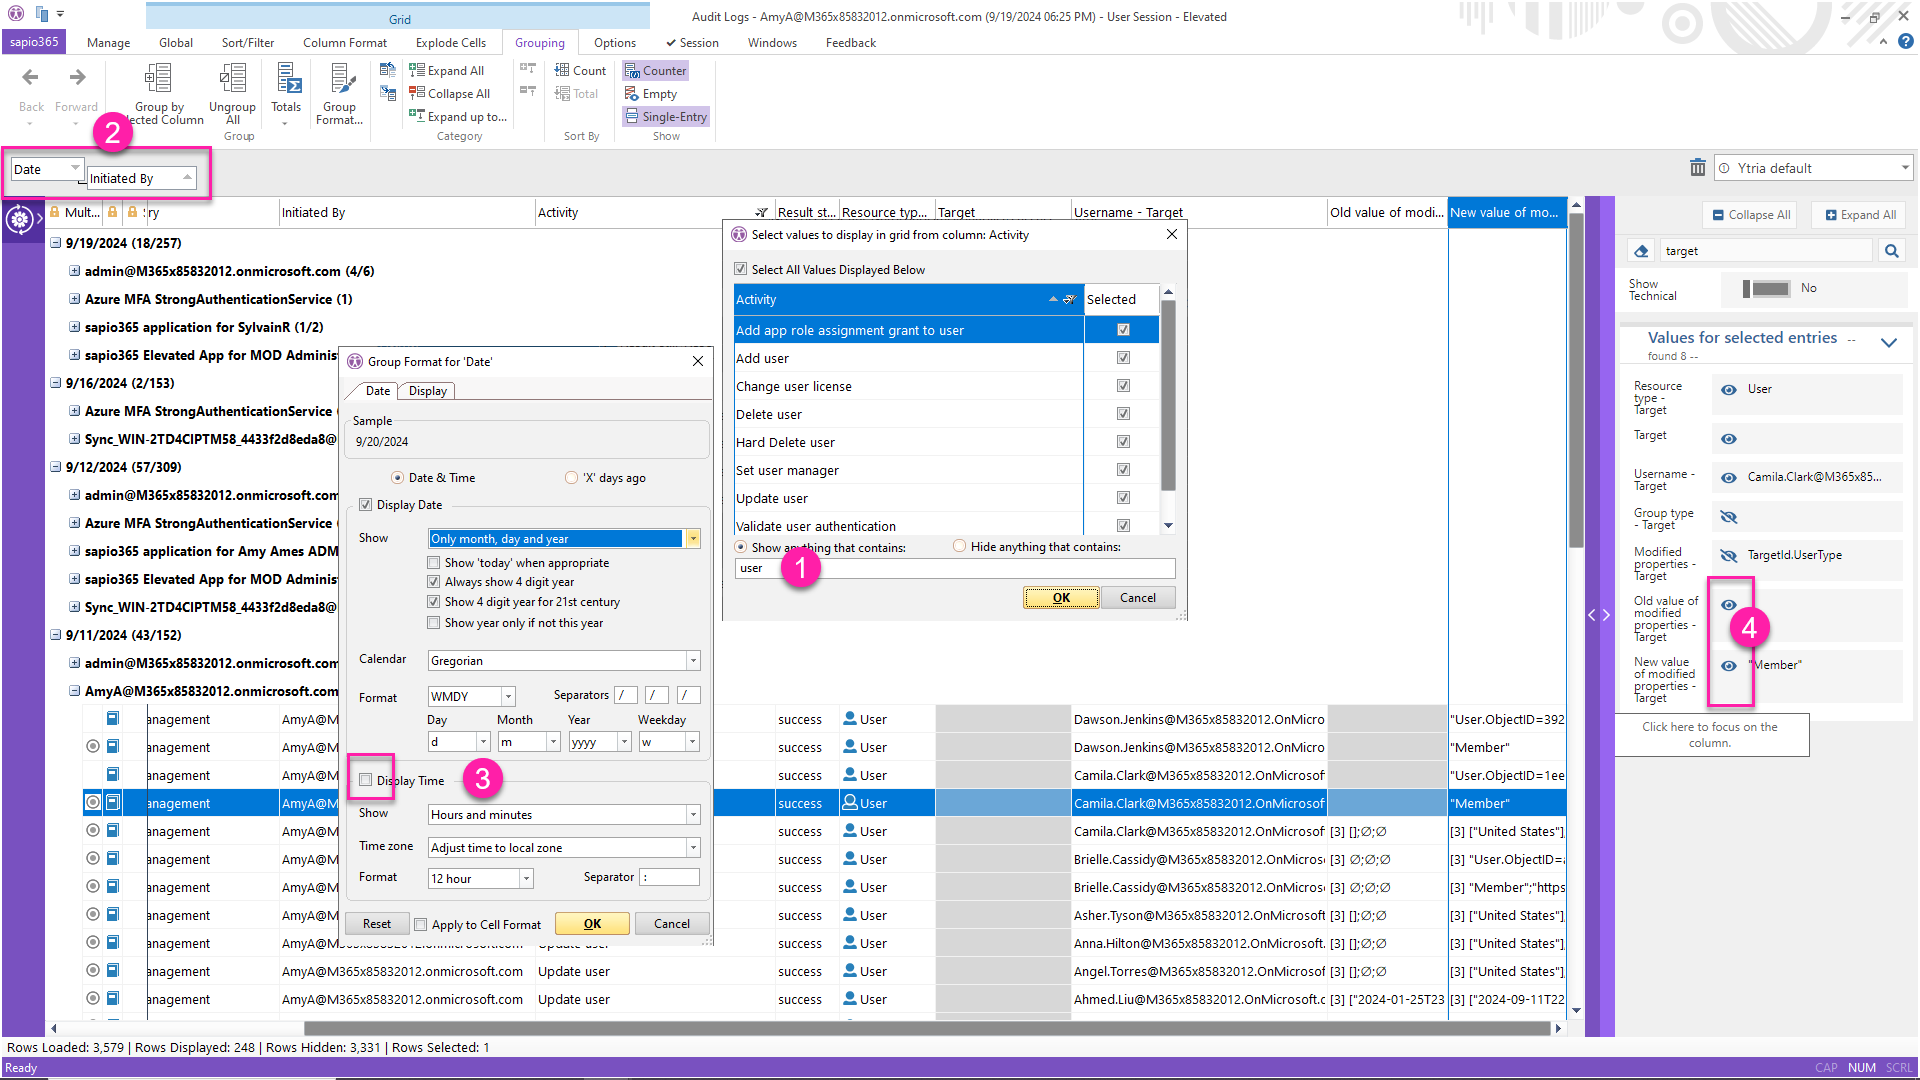
- Set a value filter on the activities you want to include. Type “user” in the filter dialog to see all relevant activities targeting users.
- Group by “Date” and then by “Initiated By”.
- Select a cell in the “Date” column or right-click its header to format group values to only show the day value. Unselect ‘Time’ to see groupings by the day.
- Show old and new target value columns to see what was changed.
Save your view to apply it again… and again
Creating the view you want for your Microsoft 365 reports may take a few steps, so once you’ve finished organizing your data, you can save the view’s grid configuration so that you can apply it at another time. This is a great time-saving feature.
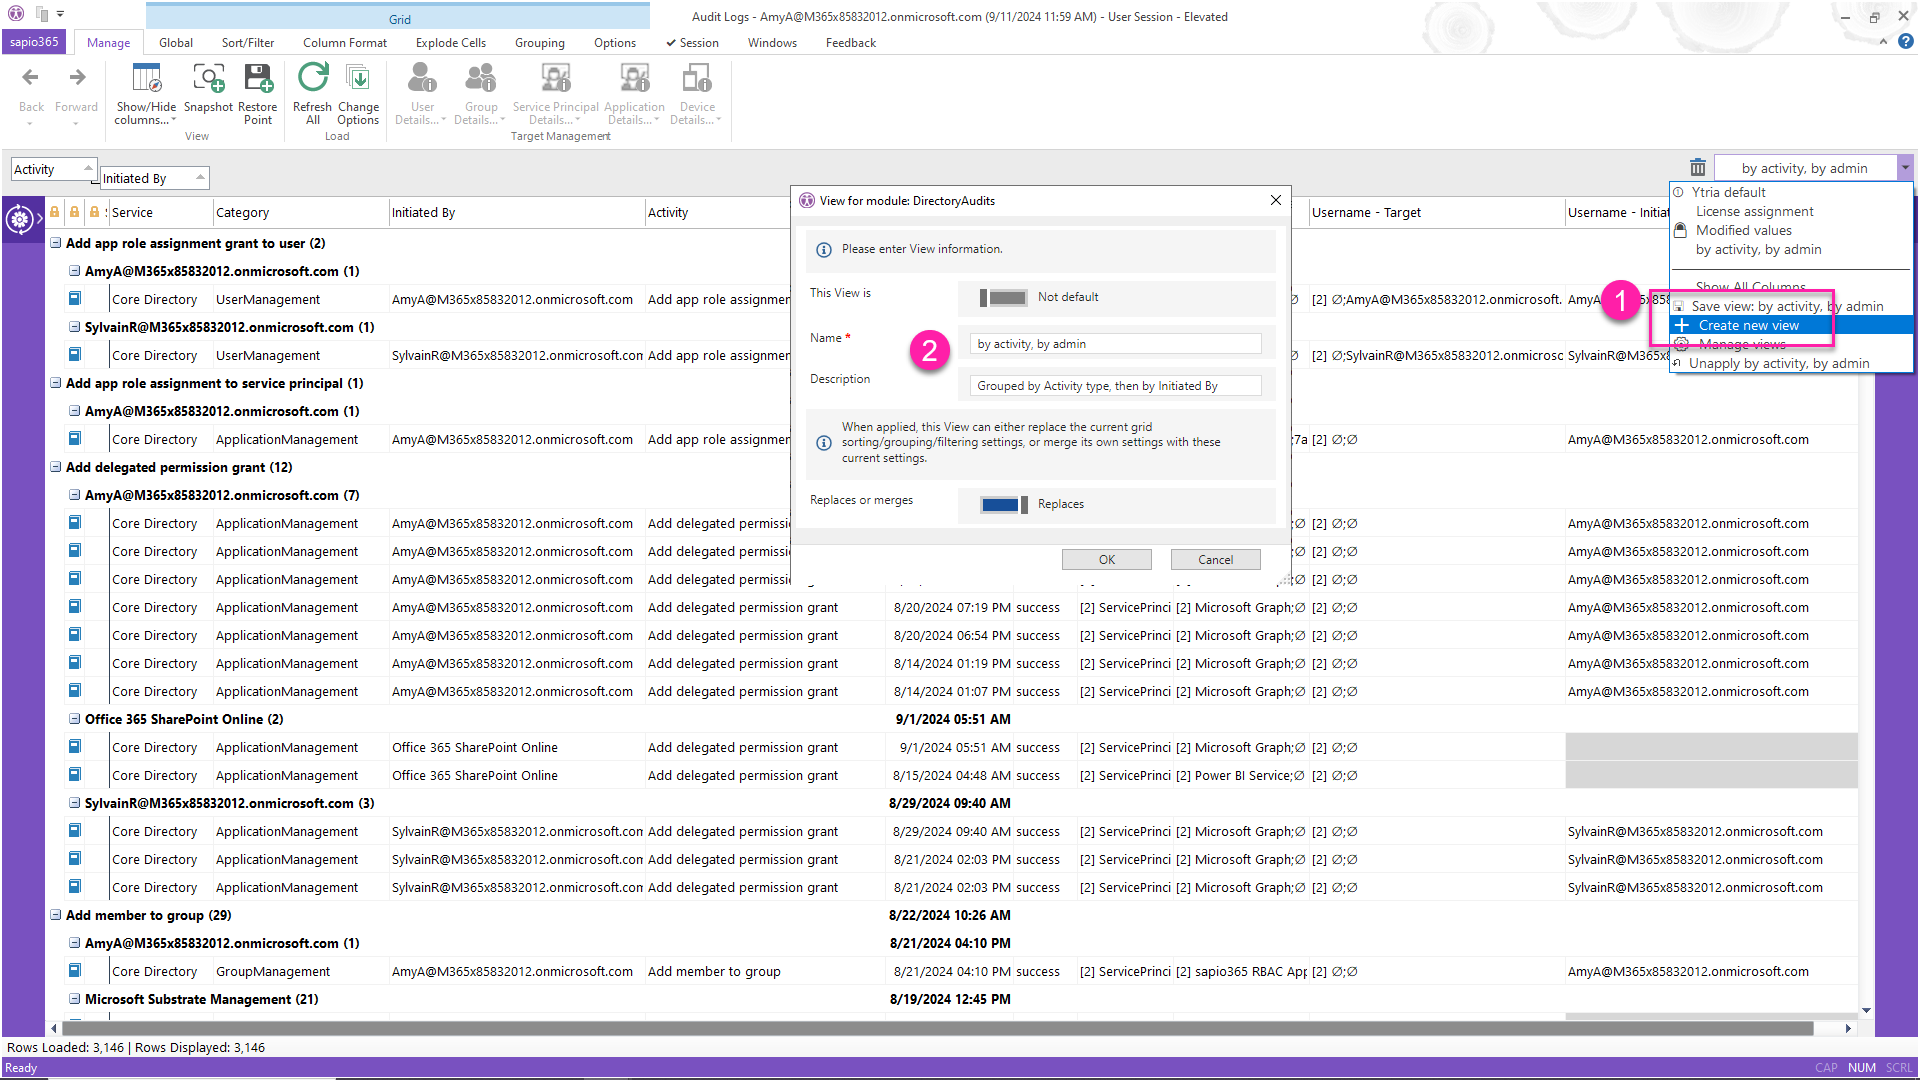
- Click on “Save View” at the bottom of the drop-down menu of the Views.
- Enter a descriptive name for the view.
You can create a view for each activity type if you’d like to have your report focus on.
TIP: If you want to omit certain activity types or admins (ex. Microsoft system agents), use value filters to select only the admins and applications you want to include. Alternatively, you can use a Regular Expression filter to omit the ones you want to exclude to ensure new admins and apps will always be accounted for.
Schedule a weekly report of the Microsoft Office 365 Admin Audit Logs
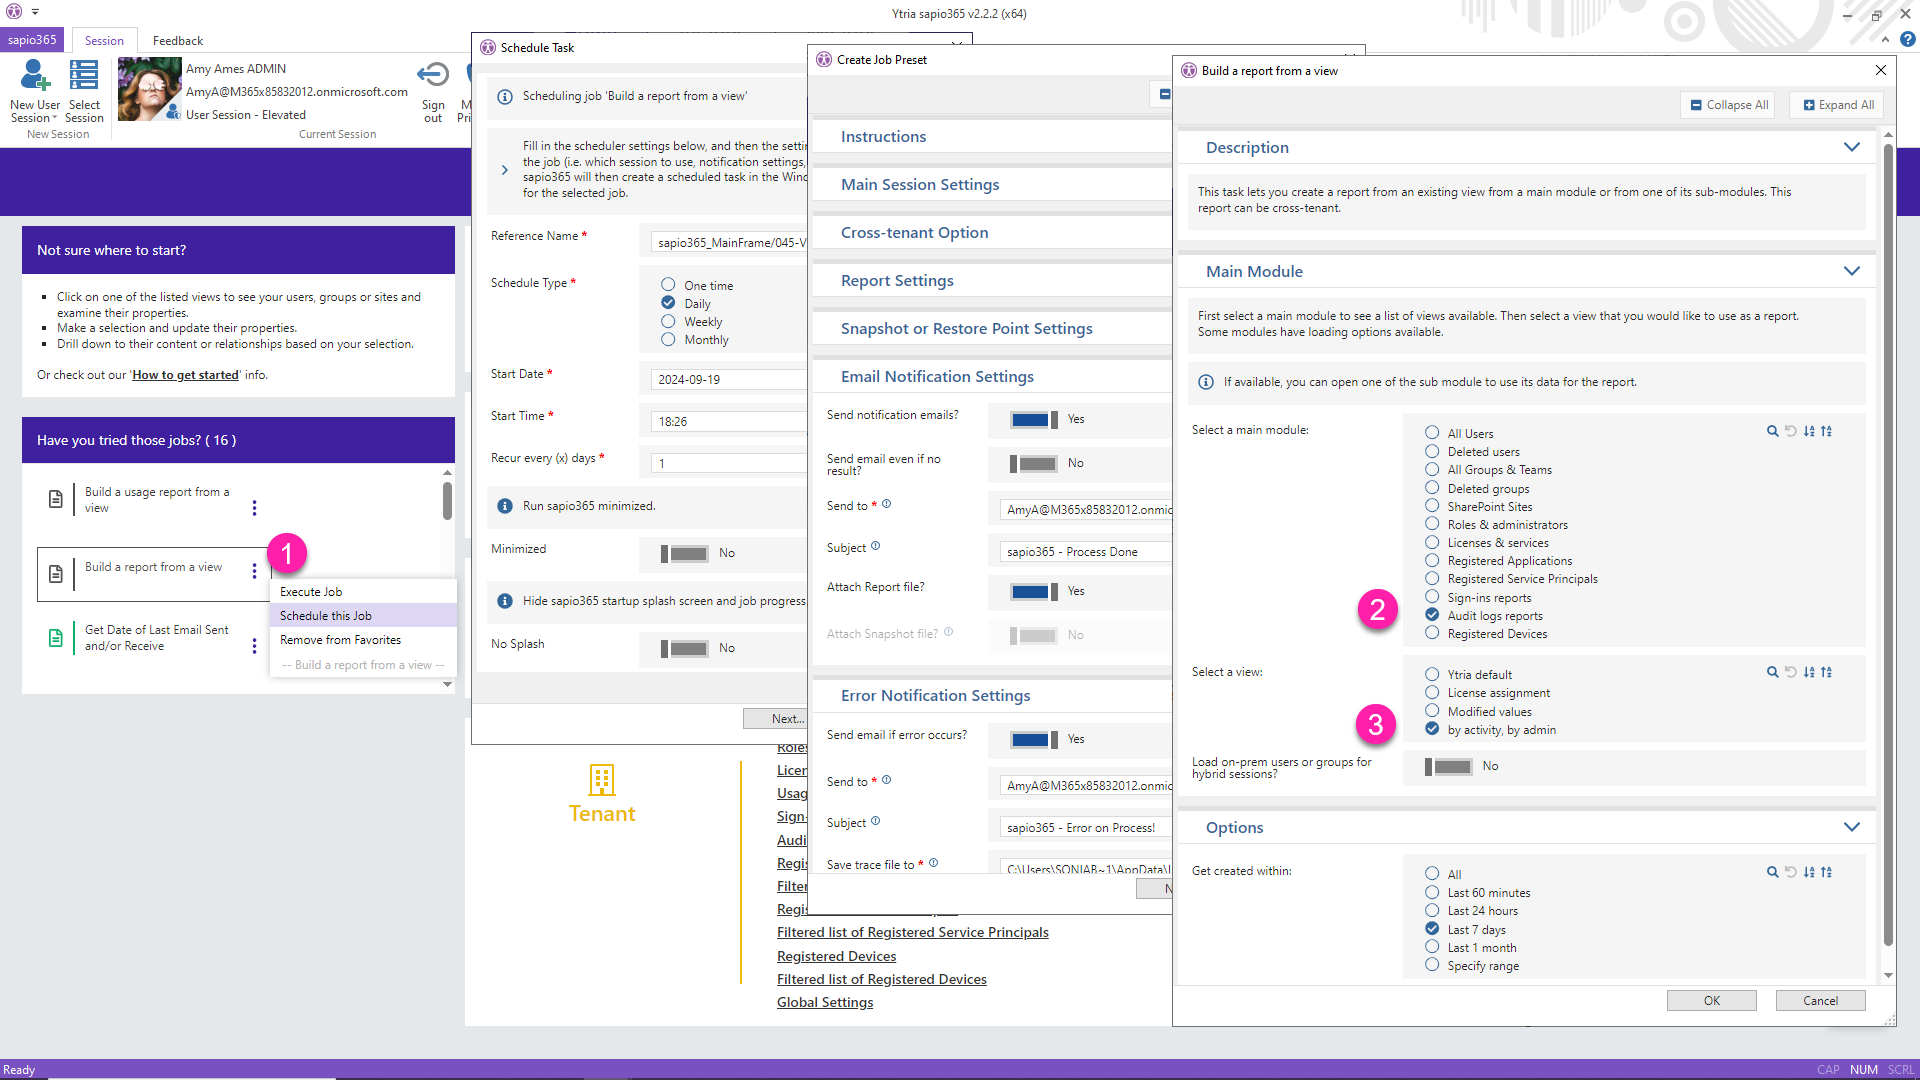
One you’ve saved views for the reports you need, you’re a few clicks away from scheduling an exported Excel file sent every week to the inbox of your choice.
- In the main sapio365 window, click on the 3 dots to schedule the job ‘Build a report from a view’.
- Select the Audit Logs
- Then select the view that you saved.
Conclusion
As with most things in Microsoft, there are several ways of accomplishing tasks. Parsing and collating audit log data from the Microsoft 365 portal is not easy. On the other hand, using Microsoft Graph API requires a certain level of skill. Being able to use a third-party software tool that can be the right solution. With sapio365, creating a report on Microsoft Office 365 admin audit logs more quickly is much easier and faster. You can also use audit logs to find out other information, like license assignment dates. Why not discover all the other IT admin tasks that sapio365 can handle.
blog_sapio365



Submit a comment