Interpret user activity traces for a portrait of global usage
Sometimes, trying to find the answers to questions like “Who is using this application” and “Is anyone really using this?” can lead you down a long trail of clues. Most of you may not have time to spend searching around in your server, picking through small details; but the answers to these questions are vital if you are planning to upgrade, migrate, or consolidate your servers.
They will also go far in helping you optimize your TCO (Total Cost of Ownership) and getting the most out of IBM Domino as a platform.
The most important decision you need to work out when starting any queries involves choosing which data to rely on for your conclusions. Although our products can uncover a wide range of traces to help you solve the mysteries surrounding your database usage, this article will focus specifically on Recorded User Activity. Collecting both Notes client and web usage data, this rich source provides you with a great amount of information towards identifying inactive applications, suspicious user activity, and more.
Recorded User Activity
In Notes, the user activity recording is on by default (enabled by the statlog task on individual databases). You can disable it by using the No_Force_Activity_Logging=1 notes.ini line.
Tip 1: Once user activity is set to record, you may want to make the activity data confidential. This will limit its visibility to users with an access level of Designer or above.
Tip 2: Through databaseEZ’s Edit Miscellaneous Properties dialog, you can collectively render User Activity confidential across all databases on a given server (see fig. 1).
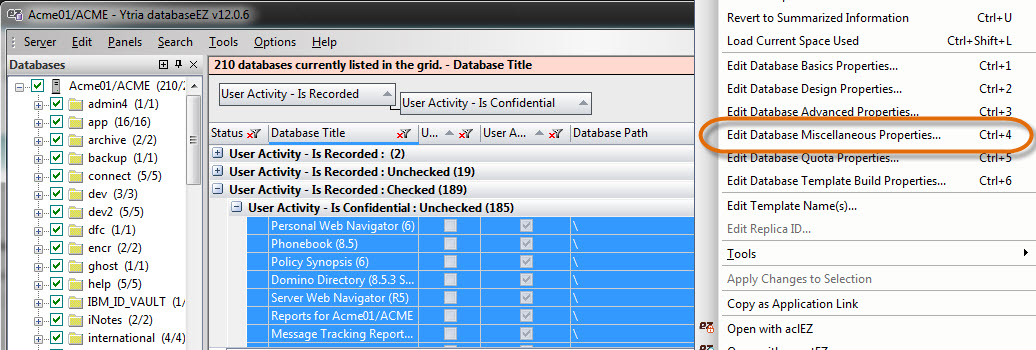
Fig. 1 Analyze and mass-edit User Activity Recording settings using databaseEZ.
When is Usage Activity being recorded?
In databases where “User Activity Recording” is enabled, each time a user accesses the application through their Notes client or the web, their activity will be recorded. However, these entries are only saved once the database object is completely closed in the user’s session. In order for the database object to be considered fully “closed,” the application must be closed throughout the Admin, Designer, and Notes clients. Furthermore, the application’s icon must not be selected on the workspace (see fig. 2).
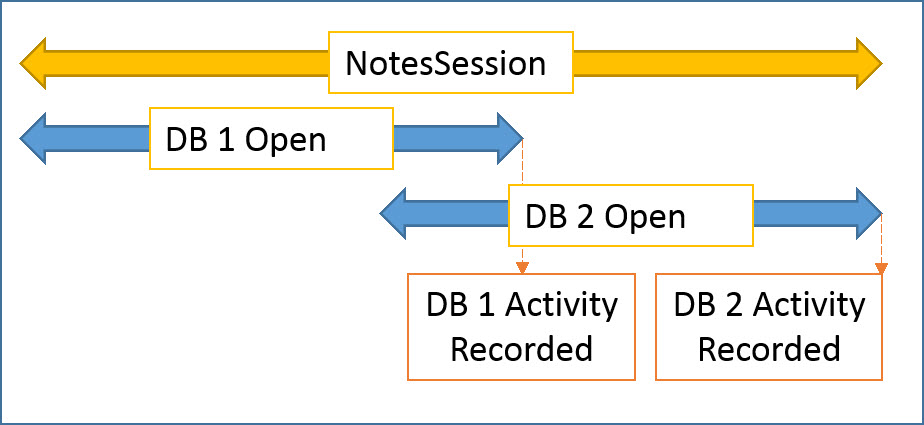
Fig. 2 Notes session with two databases open.
Tip: We can use the Show Users command for monitoring user sessions (including which databases they have open).
There is one exception to this rule: If a user opens a database and only reads designs (but no documents). That is, as long as they do not create, update, or delete anything, no activity entry will be created. An example of this situation is a user opening a frameset with a view, but no preview pane, and then subsequently closing it. During this operation, the frameset and its contents (designs) will be read; but since no documents were either opened or read, no entry will be created.
What exactly is being recorded?
Depending on which On Disk Structure (ODS) version the database in question has, the information recorded will vary. Databases with an ODS prior to 48 (R8) will record the following information: Date, User Name, Reads, and Writes (see fig. 3).
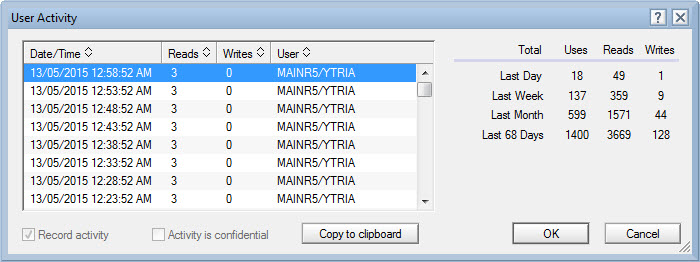
Fig. 3 User Activity recorded for databases with an ODS prior to 48.
On the other hand, applications with an ODS of 48 (R8) or later record a much larger quantity of useful information such as Reads, Adds, Updates, and Deletes (see fig. 4).

Fig. 4 User Activity recorded for databases with an ODS equal to or above 48.
Still, as it turns out, Notes actually stores quite a bit more information than what is listed above. What you see for each activity is merely the summary of its Data (i.e., Document Class) and Non-Data (e.g., designs, ACLs, etc.) counters (see fig. 5). Since Notes keeps different counters for Data and Non-Data, a good supply of details is just waiting there for you, accessible exclusively through databaseEZ or scanEZ.
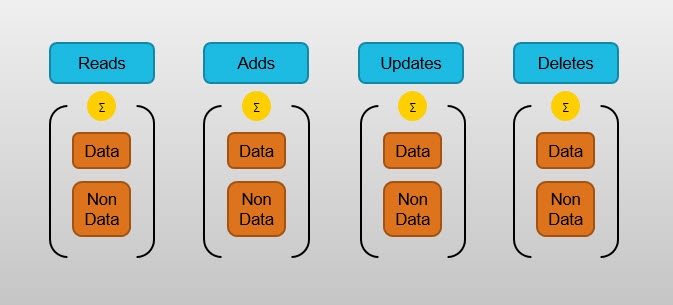
Fig. 5 Data and Non-Data counters are added up and summarized for display in the Notes client.
A few things to keep in mind
Constant Data Reads/Updates:
In certain databases, you will notice that a trace is left in their usage activity for every single instance they are opened (whether or not any documents have been read or updated). This is usually an indication that profile look-ups and/or updates have been hard-coded into the database open event.
Deletions with ODS prior to 48:
Because Reads and Writes are the only two actions displayed for databases with an ODS prior to 48, deleting a document in these databases will be displayed as an entry in the Writes column.
Soft deletions:
In databases where Soft Deletion is enabled, a document is considered to be deleted (and is marked as such) the moment it has been soft deleted. After that, its permanent removal will not be recorded at all. Furthermore, if the soft-deleted document is restored, the restoration will be recorded as an edit.
Replication:
Since neither user activity objects nor usage activity recording settings replicate, it’s important to gather usage activity from all replicas when evaluating “who has accessed what.”
Replication (cont.):
When a local replica replicates with a server, no trace will be left in the replica’s Replication History. All replication, be it from server to server or local to server, is properly logged in the User Activity (see fig. 6).

Fig. 6 Various replication events explained through User Activity.
Anonymous web activity:
Although web activity is recorded, trying to monitor web sessions presents some problems. When it comes to Anonymous users, you will notice that the amount of recorded User Activity entries doesn’t match the actual number of unique visitors. The reason for this is that the Domino server does not differentiate between concurrent Anonymous sessions. Thus, Recorded User Activity is not a reliable source for analyzing web traffic for unauthenticated users. This is usually achieved by using the Domino Web Server log, a service that, among other functions, allows you to differentiate between unique IPs.
User Activity limitations
For databases with an ODS prior to 48, the maximum size of the user activity object is 61600 bytes. Because each entry takes up 44 bytes, the hard limit for the number of entries is 1400 per database.
For applications with ODS48 and later, the object size is 128800 bytes. Even so, because each entry takes up more space (exactly 92 bytes), the end result is the same 1400 entry limit.
Considering this limit, this means that heavily used databases will most likely contain user activity entries from only the past few days. On the other hand, databases that are used less frequently could possibly display user activity entries spanning months, or even years.
Thus, the smaller the difference is between the oldest and newest entry dates, the more often the application is used. On the flip side, a large difference between the two dates indicates a seldom used database. This is what makes the User Activity data so helpful in identifying your most (and least) used databases (see fig. 7).
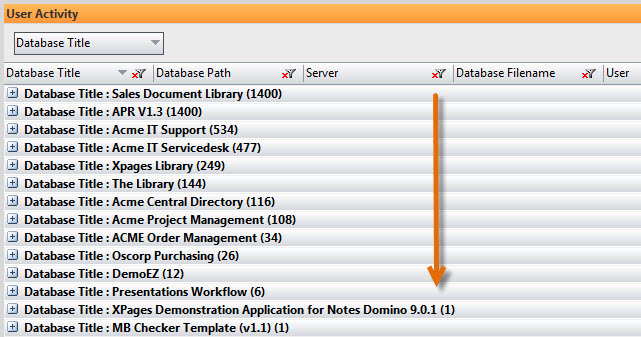
Fig. 7 Once databaseEZ’s User Activity Analyzer has loaded all activity entries, simply sort by number of entries found to identify your most (and least) frequently used applications.
Irrelevant entries
Relying indiscriminately on the entire Recorded User Activity data can lead to misunderstandings. Users, agent signers, and servers all create identical entries when performing transactions (see fig. 8). Later on in this post, we will look at a real-life example of a common dilemma this creates and how databaseEZ can help you solve it.

Fig. 8 The User Activity display does not distinguish between activity entries for servers, agent signers, and actual users.
What can databaseEZ do for you?
In databaseEZ you now have access to an even wider range of useful activity tracking features:
- Obtain all, or selected, user activity entries from as many databases as you need on a given server
- Pinpoint a given date/time range for one or more users thanks to precise filters
- Display and analyze the data you retrieve in the flexible Ytria grid
- Further filter your results through the Ytria grid by removing server or agent signer entries to create a clear and accurate picture of who has really been using your applications
- Make use of both Data and Non-Data counters to focus on users who actually read, added, or edited information (be it data, designs, ACLs, etc.)
Practical Example: Archiving unused mailboxes
A customer recently requested our help in identifying orphan mailbox databases (mailboxes belonging to users who have left the company and are thus sitting idle on their production servers). This is, actually, quite easy to do with the help of both databaseEZ and aclEZ.
Both products can provide us with the Mail Owner’s information. (If we find a Calendar Profile on a given database, we can read out its Owner item value.) Both products also provide the Check Presence in NAB feature that allows us to see which mailbox owners are no longer with the company (see fig. 9).

Fig. 9 Mailboxes categorized by “whether their owners are still working for the company”.
However, this particular case required a bit more exploration.
Using the tools mentioned above, we ended up identifying roughly 30 orphan mailboxes. Yet our customer needed to know if these mailboxes remained in use by a successor or an assistant.
This was a perfect application for databaseEZ’s unique ability to collect user activity for all the databases in question. Since our goal was to find any databases with real user activity within the past 3 months, we simply took the following steps:
- Before loading user activities, we applied the pre-set filter to isolate only user activity from the past three months
- We then used the value filter option directly on the User Name column, removing Administrators, Servers, and Agent Signers from the grid (see fig. 10)
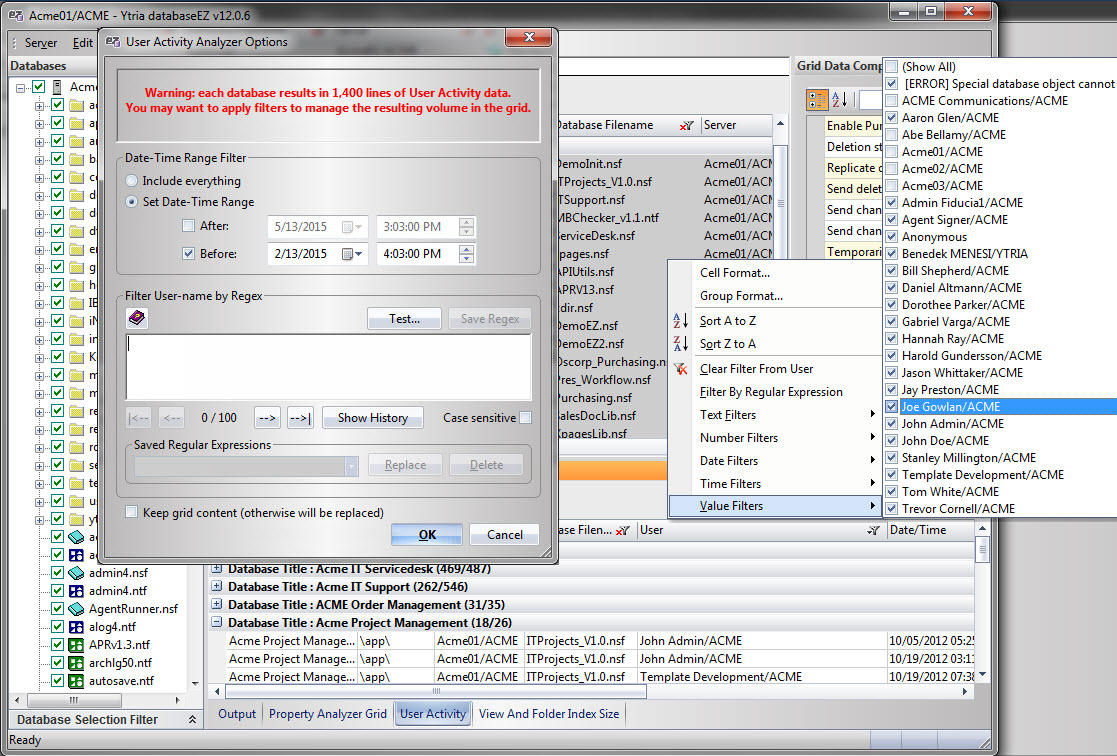
Fig. 10 databaseEZ’s User Activity Analyzer offers various pre-loading and grid filters.
Once we had finished applying the filters, all we had left to do was group the activity entries by databases. In the end, we discovered that only five mailboxes out of those 30 were still being used.
That cleanup returned over 40 GB of disk space back to our customer.
All things considered, the Recorded User Activity leaves a solid trail to follow when you know how and where to look. Isn’t it good to know that you have such an able “detective for hire” in databaseEZ?

You can find out all details activity in domlog.nsf file, it is capturing all activity like addition, deletion, user name and user PC IP address with time stamp, it very full proof activity is capturing,
I will recommended to user Domino Xpage web application is very fast and secure ,reliable.
Logging to a database is somewhat slower than logging to text files, especially at very busy sites, and the size of the database can become large so that maintenance becomes an issue. However, if you use the Domino Web server log, you can treat this information as you would other Notes® databases, and you can use built-in features to analyze the results.
The Domino Web server log (DOMLOG.NSF) logs all Domino Web server activity and tracks this information about each HTTP request:
Date and time the request was made
User’s IP address (or the DNS address if DNS lookup is enabled in the Server document)
User’s name (if the user supplied a name and password to access the server)
Status code the server returns to the browser to indicate its success or failure in generating the request
Length of the information, in bytes, sent from the server to the browser
Type of data accessed by the user — for example, text/html or image/gif
HTTP request sent to the server from the browser
Type of browser used to access the server
Internal and Common Gateway Interface (CGI) program errors
URL the user visited to gain access to a page on this site
Server’s IP address or DNS name
Amount of time, in milliseconds, to process the request
Cookies sent from the browser
Translated URL (the full path of the actual server resource, if available)
Whether the request resulted from a Web site search
Whether the request came from an advertisement on the google.com site
This is well complemented by the in-depth application usage data that can be provided by NotesTracker (a development tool for enhancing individual database designs).
After a quarter century at IBM and working with Notes/Domino since 1883, I have now retired. Fortunately Alex Elliott of AGECOM has taken over the mantle of providing and supporting NotesTracker
Actually worked with Notes/Domino starting in 1993 (just as Release 3.0 was announced) — not 1883 !!!
I don’t understand this statement
”
Replication: Since neither user activity objects nor usage activity recording settings replicate, it is not important to gather usage activity from all replicas when evaluating “who has accessed what.”
“
Gentlemen, thank you for all your comments. Let me try and address them below.
@Alam- Luckily, there are multiple available data sources for analyzing usage. All of them come with their pros and cons. Domlog.nsf can be a rich data source for understanding web traffic, however, it won’t record client side usage, nor as much detail on Notes Database transactions as the recorded user activity analyzed above. Even though incoming URL patterns can be translated into transactions and displayed in views, this can get rather tedious. What we often see, through our customer experiences, are web logs that are mostly managed through text files rather than domlog.nsf.
In order to get an accurate analysis on usage activity, we wanted to use a data source that allows us to combine web and client side activities, while keeping the ability to dig into the details when needed. This is why we believe Recorded User Activity Data is one of the best available options.
@Tony- Thanks for the information. As a recap, databaseEZ is a solution that works right out of the box, and that doesn’t require server installation; because it extracts valuable information from the Usage Activity data, you do not need to change any application designs on your server.
@Jos – Thanks for letting us know! This was a typo and we’ve now corrected it. The idea is to check usage activity across all replicas to get a full analysis.