How to customize a Microsoft Office 365 license cost report
When budget time comes around, IT admins may be asked to create a report that shows the Microsoft Office 365 license cost to the organization. Depending on the organization, this may need to be reported by department, per user or by geographic region which will result in some customization.
The challenge facing IT admins is that the Microsoft Admin Center provides a list of user accounts and other related information, but the data must be filtered to create a report that is categorized the way you want it. The Admin Center is unable to export a filtered view so you will have to export your unfiltered data to Excel.
Once you get your data into an Excel spreadsheet with the Microsoft Office 365 license costs, they will need to be manually filtered and reconciled in Excel which will take some Excel expertise. Another alternative would be to use PowerShell, but again, that requires a level of expertise that not all Microsoft IT admins possess. A final alternative is to use a third-party software tool to get the job done. Let’s look at each method in more detail.
Build a report from the Admin center
Unfortunately, as mentioned above, there is no direct and easy way to export a list of users with assigned licenses from the main Microsoft 365 Admin Center.
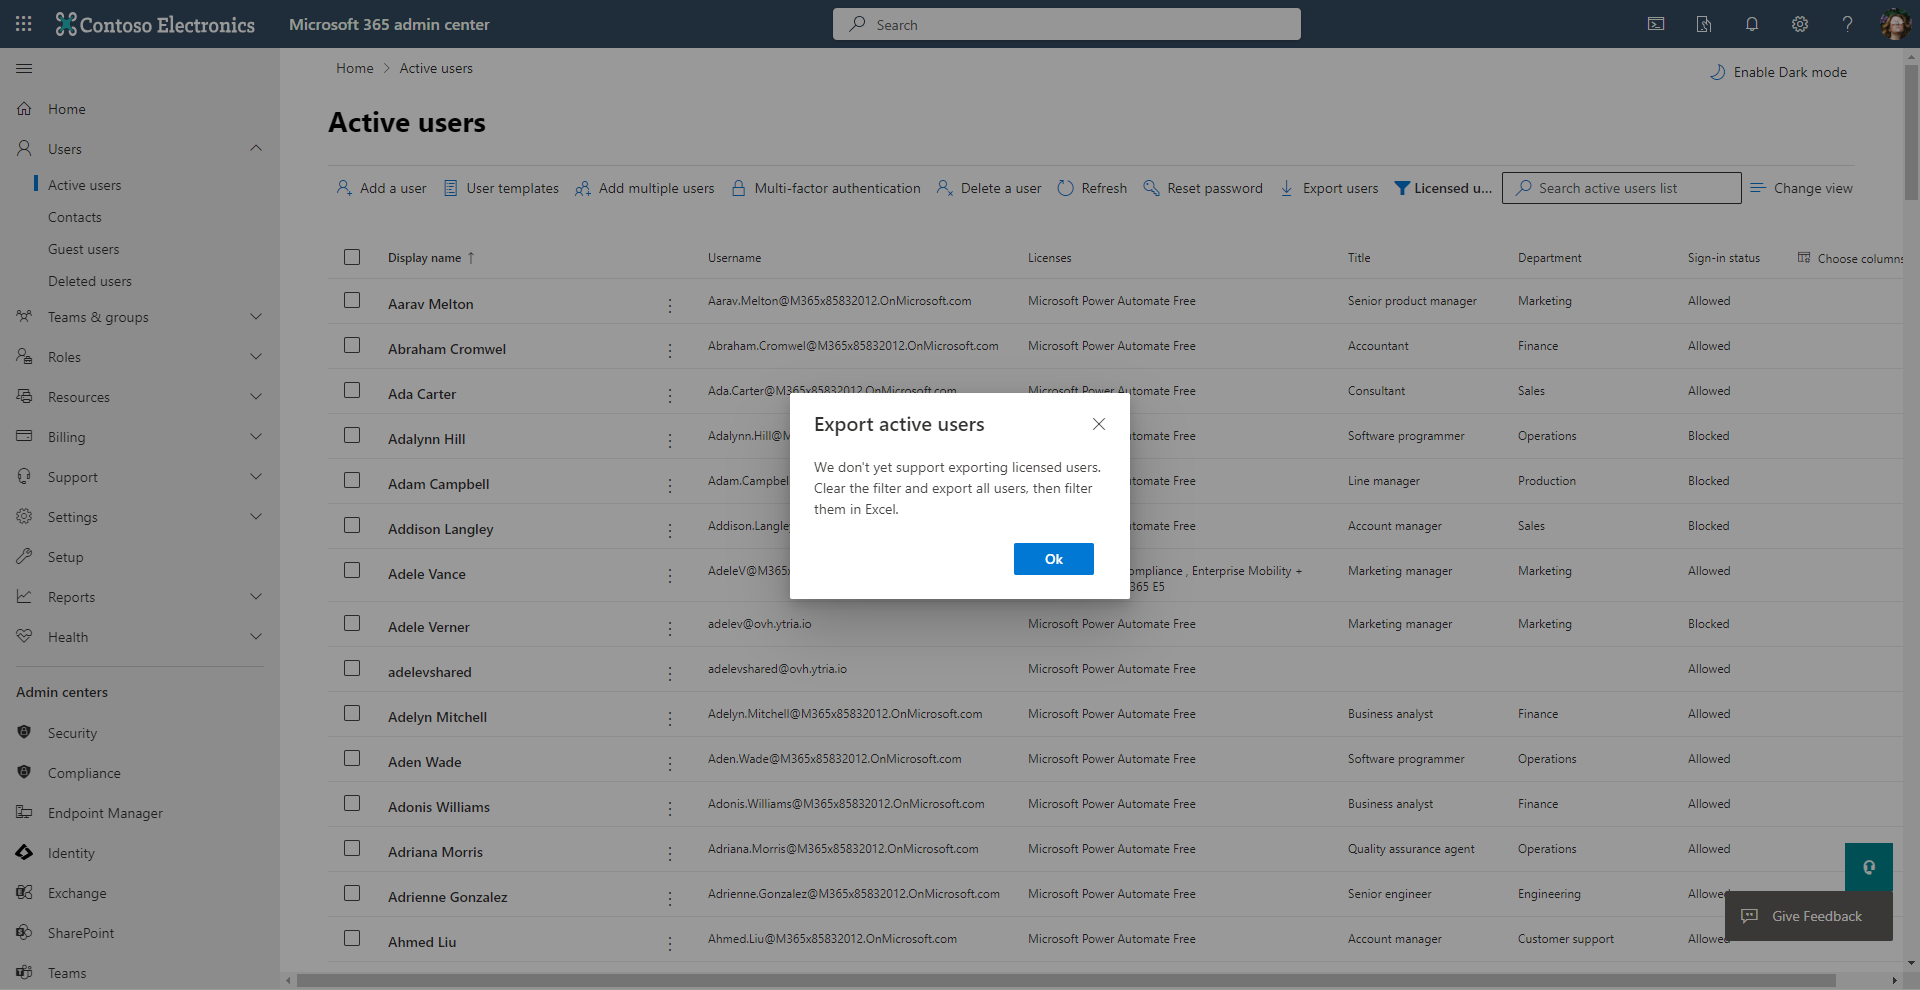
Although a filter exists to view licensed users, exporting that view is not available. As the image below shows, filters must be removed before exporting. You’ll need to manually filter after exporting your information to a csv file.
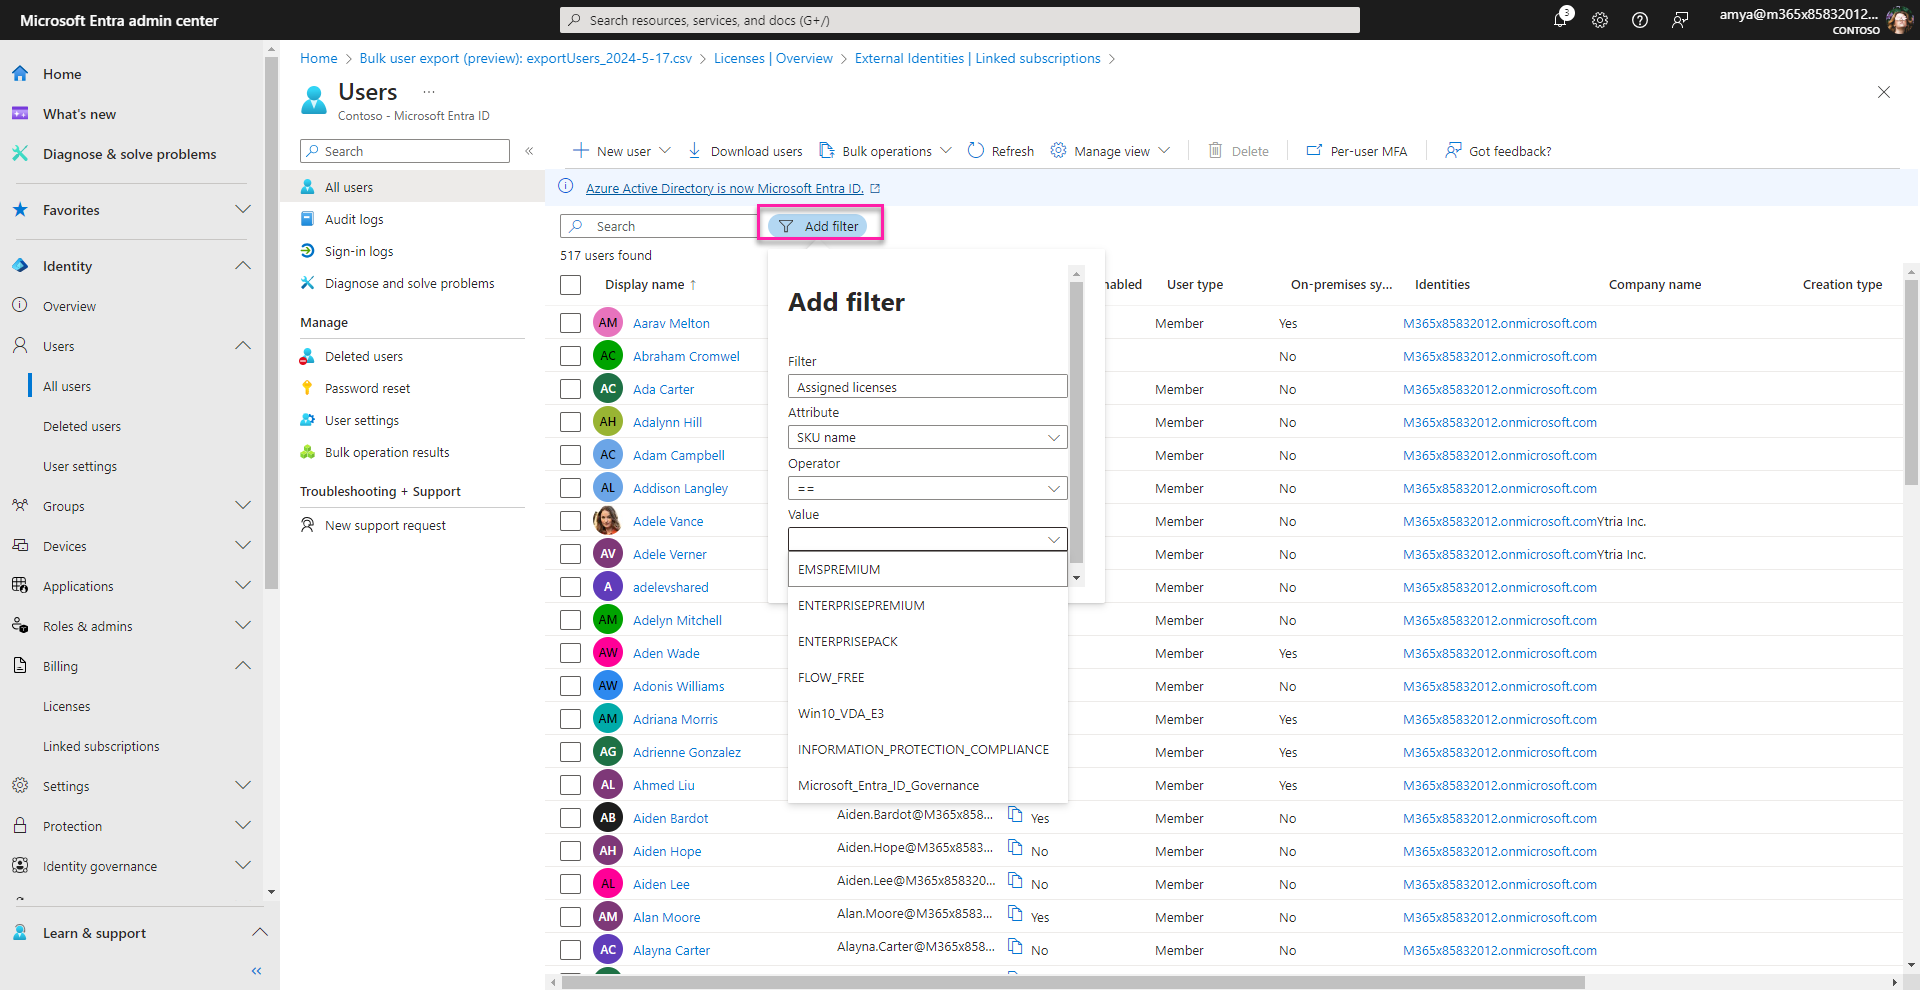
Similarly, in the Entra Admin Center, you can export all the data, or you are limited to exporting users by each assigned license. This filter does not offer the ability to filter out unlicensed user accounts. Using more than one license assignment filter results in combining them in an “AND” operation instead of an “OR” operation.
In both cases, you end up with a csv file which you must convert to Excel before adding reference formulas for license costs and organizing your data (you’ll also need to clean up unnecessary properties that were exported by default).
This is a very tedious process that can introduce errors due to manual data reconciliation.
Export a Microsoft Office 365 license cost report with Microsoft Graph PowerShell
Getting a list of users, their properties and their licenses assigned is straightforward with Microsoft Graph PowerShell.
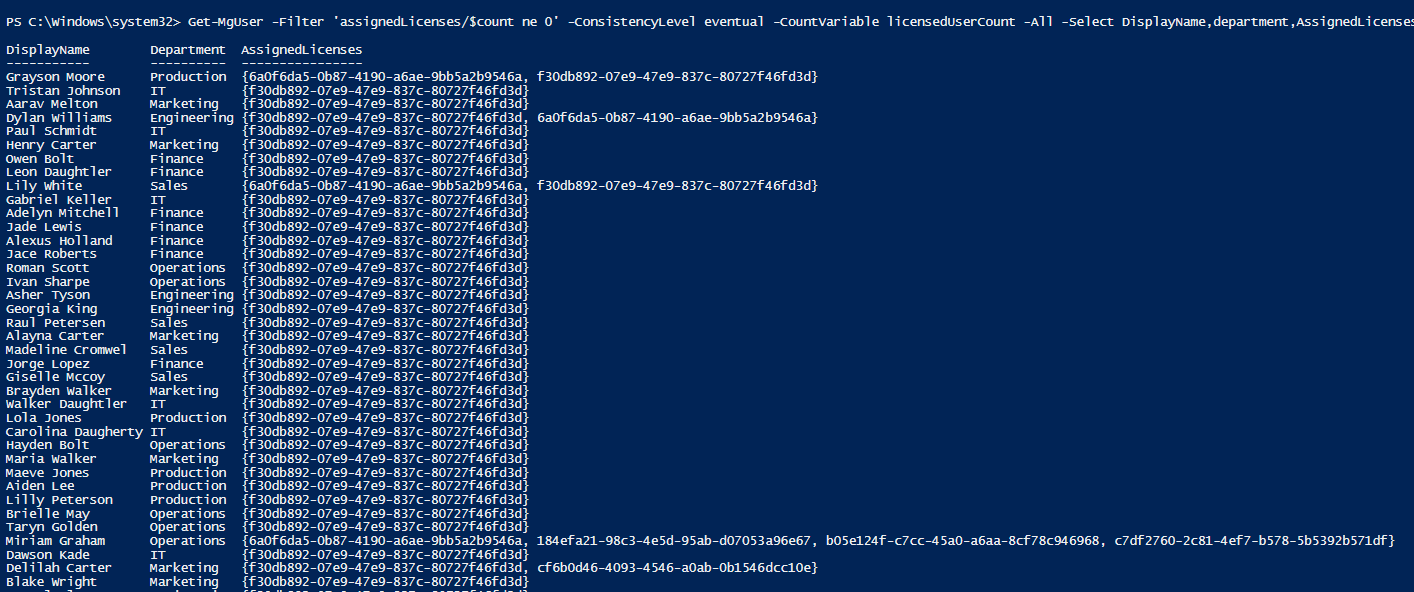
For example, this cmdlet gets a list of users with specified properties display name, department and assigned licenses:
Get-MgUser -Filter ‘assignedLicenses/$count ne 0’ -ConsistencyLevel eventual -CountVariable licensedUserCount -All -Select DisplayName,department,AssignedLicenses | Format-Table -Property DisplayName,department,AssignedLicenses
Note however that only license SKUs are returned instead of the names of the licenses, which means you’ll need to translate these for your report before you can assign an Office 365 license cost.
To include the equivalent license names and license costs for each user or department, you’ll need a more complex script. And just like exporting from the admin portal, the csv results may require further processing to be report-worthy.
Create a custom report of Microsoft Office 365 license costs by department in sapio365
Using a third-party software tool like sapio365 can save you a lot of time and effort. With sapio365, you avoid all pagination issues or the need to aggregate information. It gives you a full and extensive view of all your data in one place. With this information at your fingertips, you can then filter, sort and organize the data easily with a few clicks. Unlike PowerShell, you can preview any changes before you commit to them so the risk of unexpected errors is eliminated.
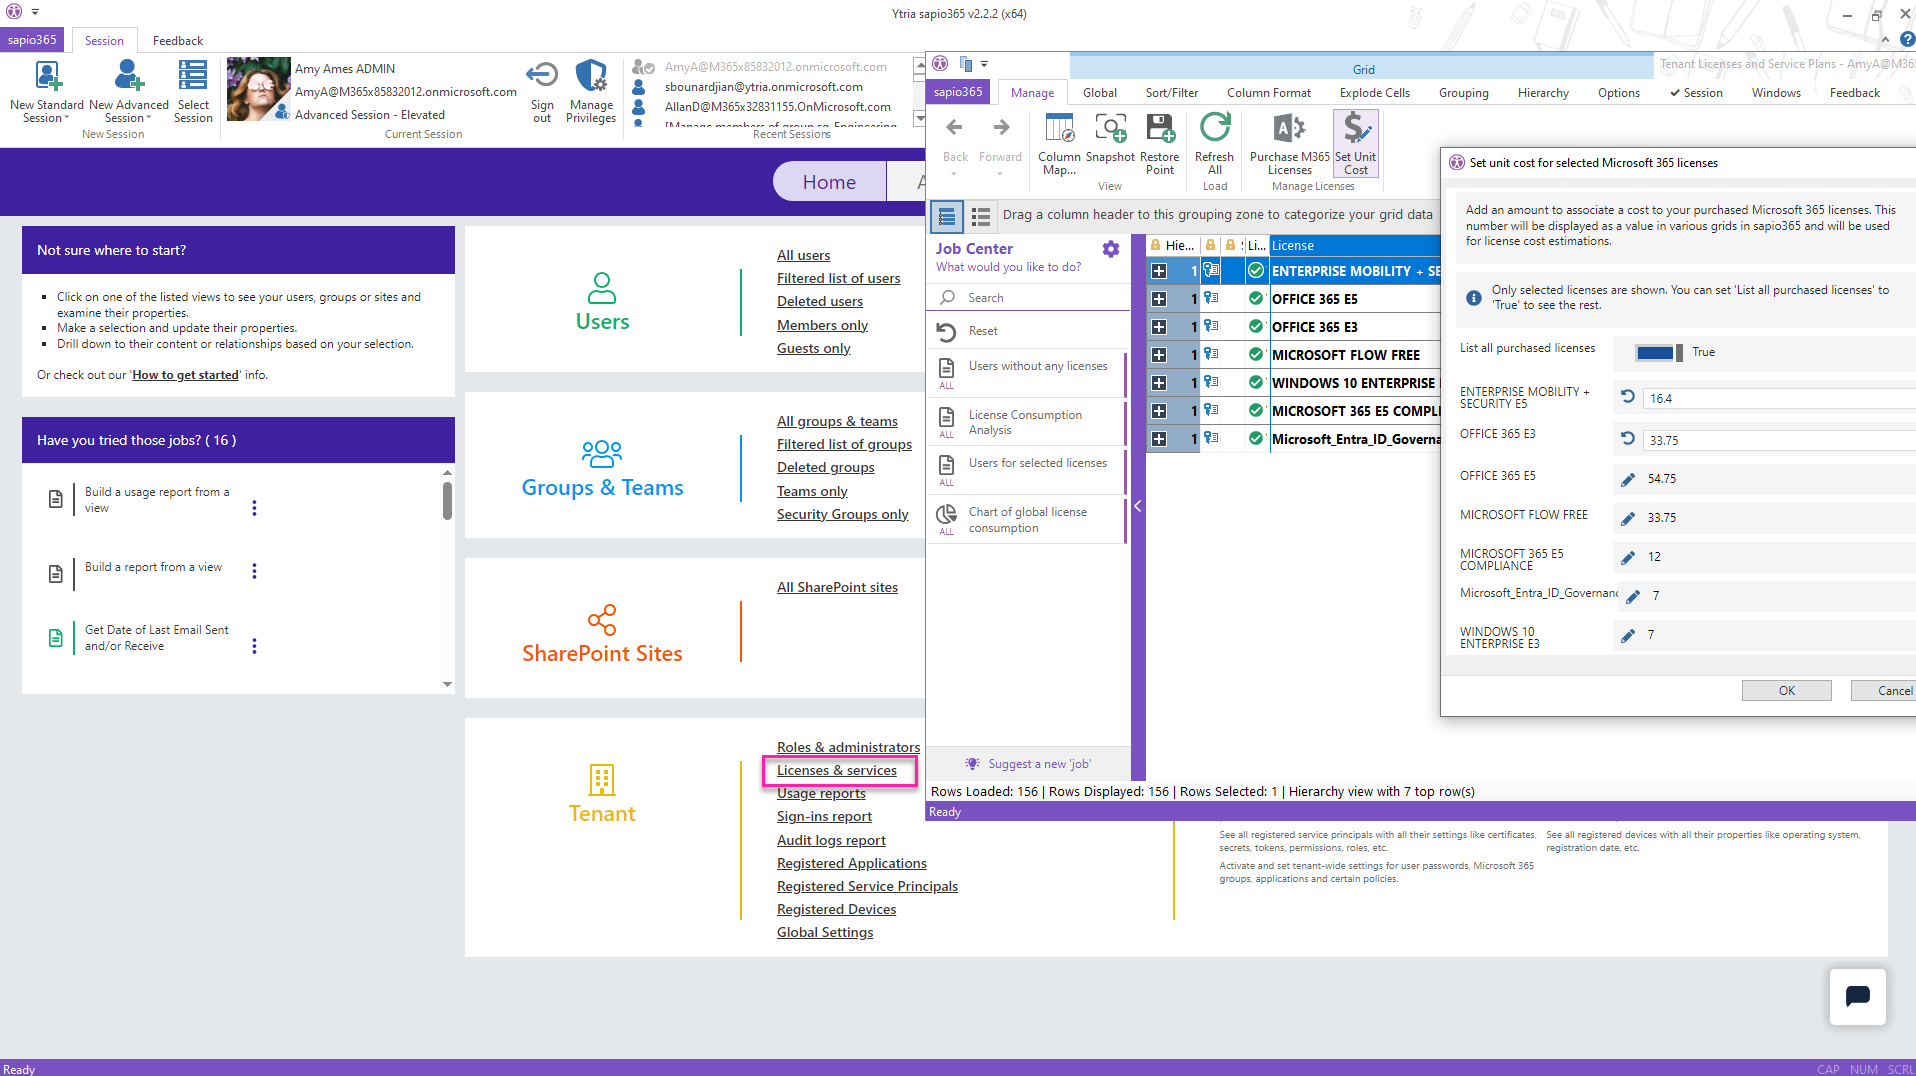
The first step is to associate a cost to each type of Microsoft Office 365 license in your environment. This is done by retrieving a list of purchased licenses by clicking Licenses and Services on the main page of sapio365.
Then you can select the licenses for which you want to set the unit cost, or toggle ‘List all purchased licenses’ to True. Click on the pencil icon to set the cost.
You should be aware that if you manage several tenants, the amounts you set are specific to each tenant.
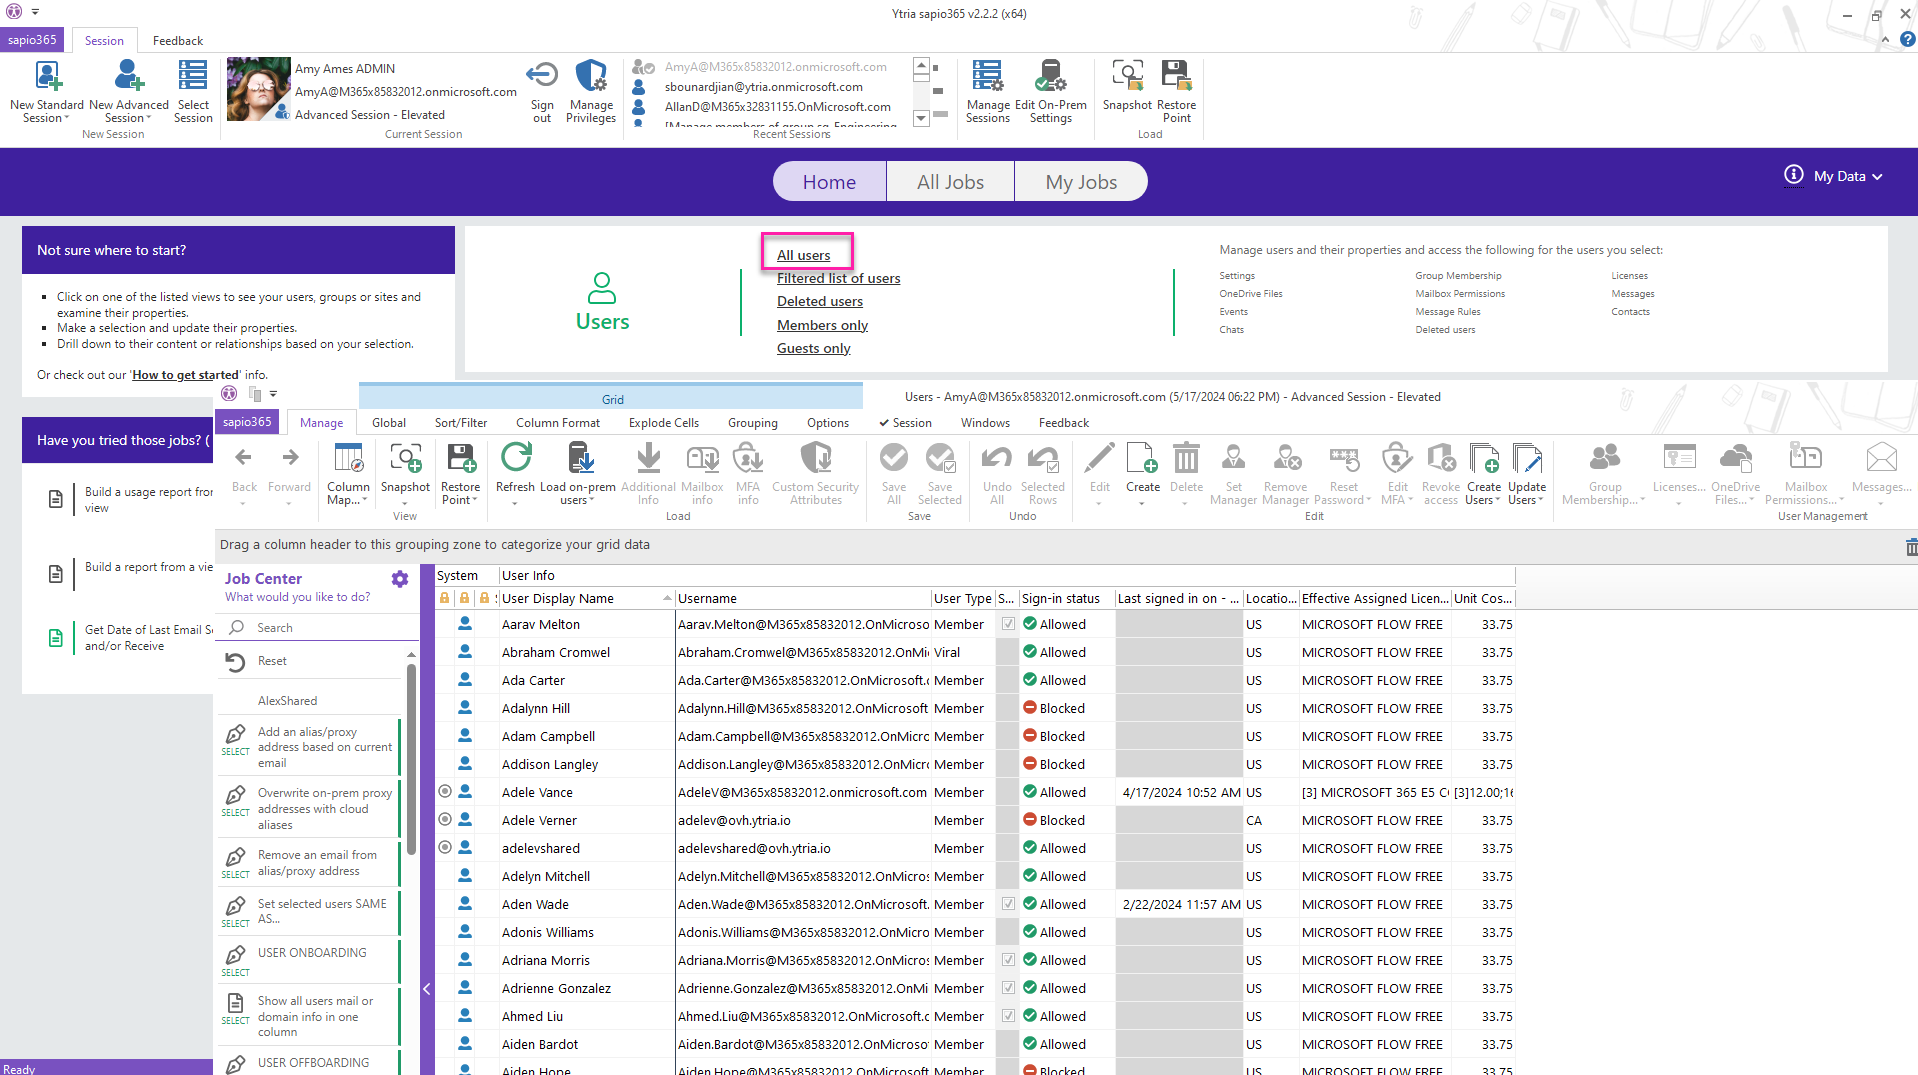
Next, click on All Users in the sapio365 homepage, and you’ll see the complete list of user accounts, the Microsoft Office 365 licenses they have assigned and the unit cost for each.
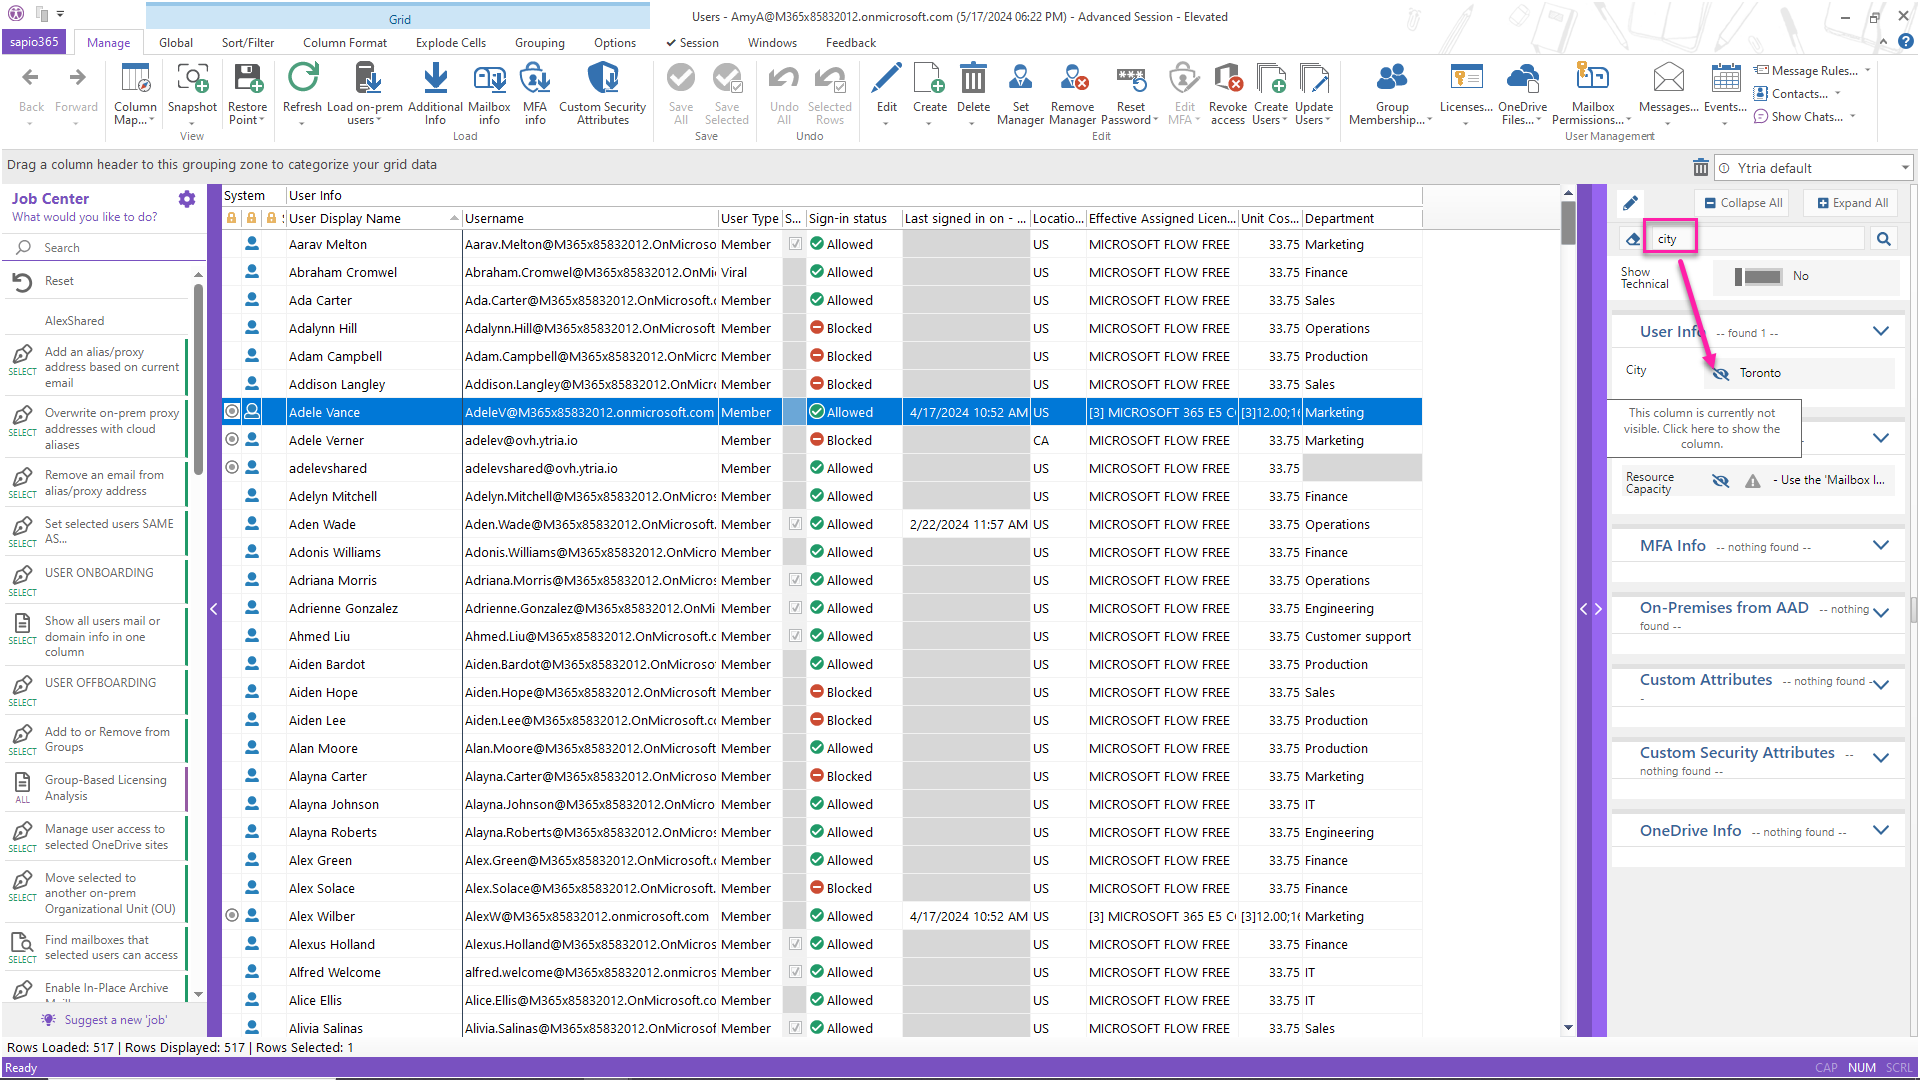
Add the department or any other user property to the view.
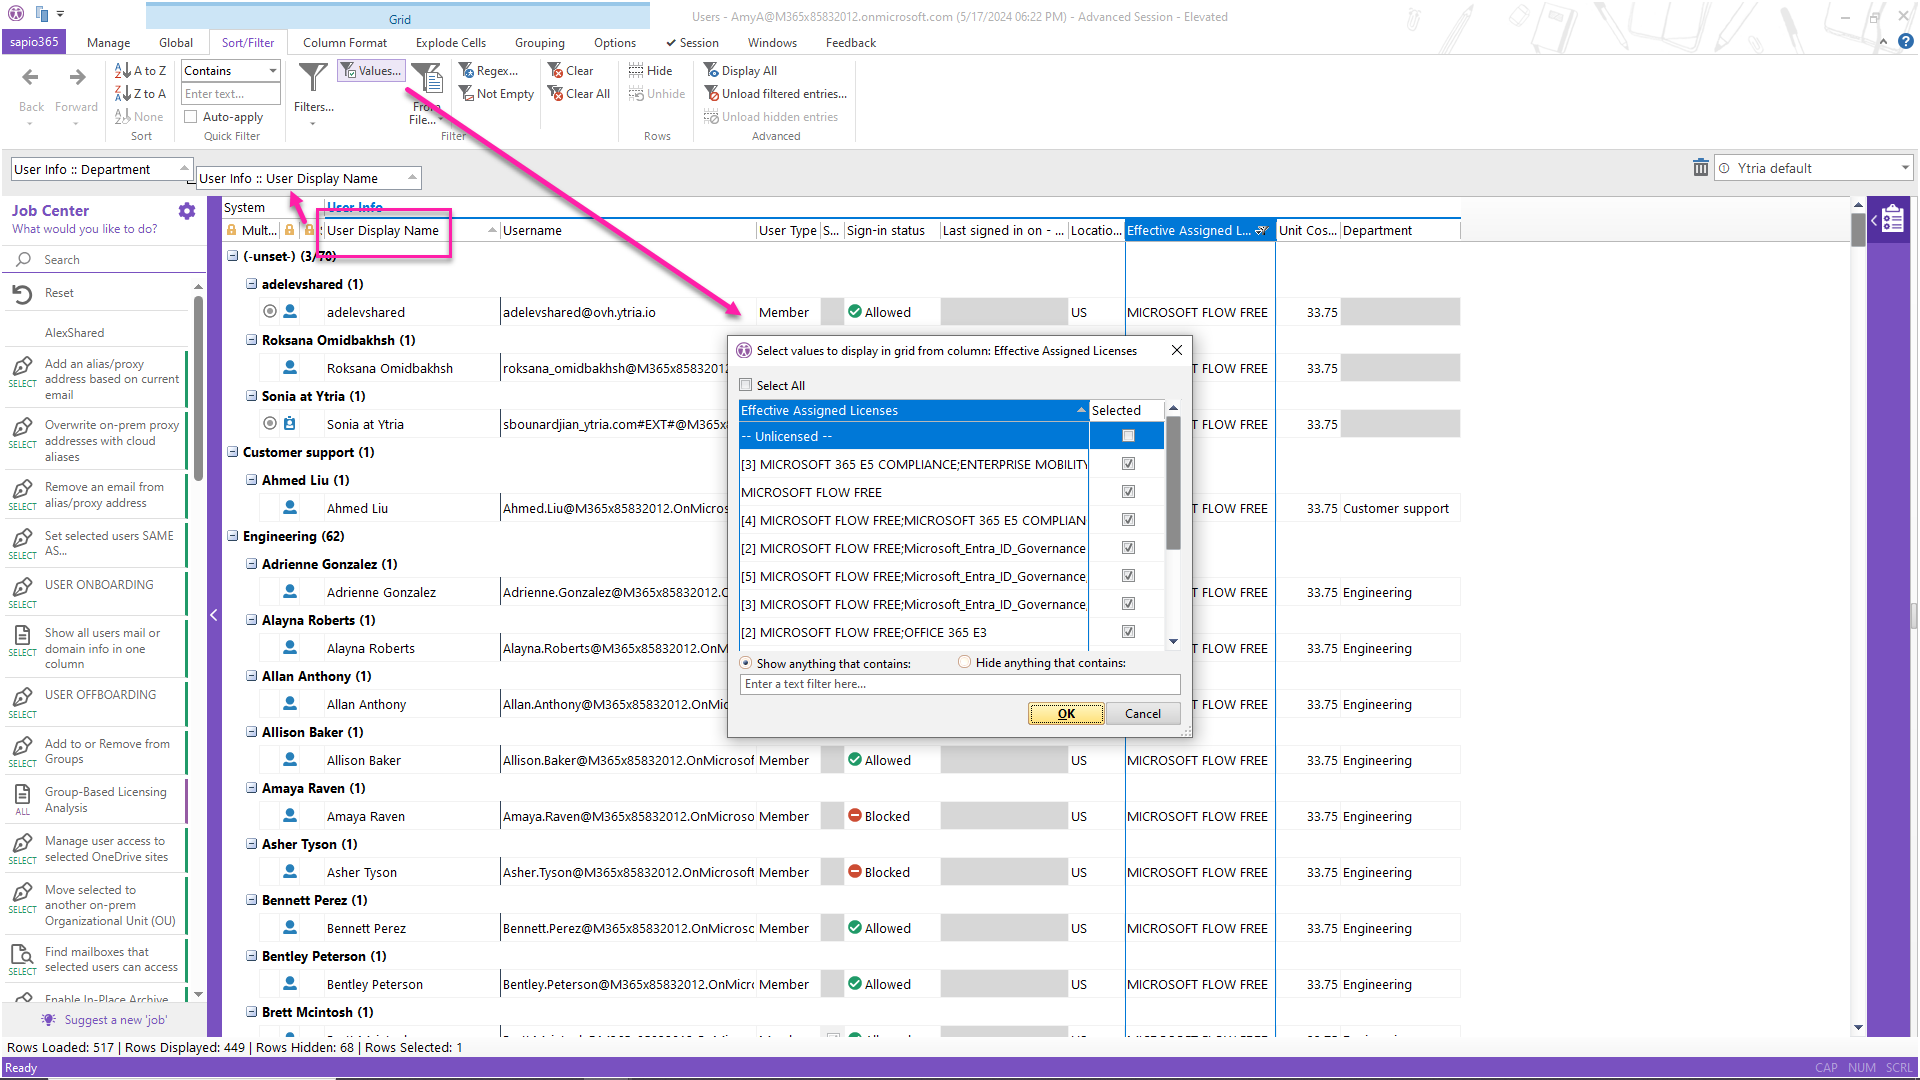
Next, filter out the unlicensed accounts and then group the data by department by dragging the column header to the top left of the grid, then by the user.
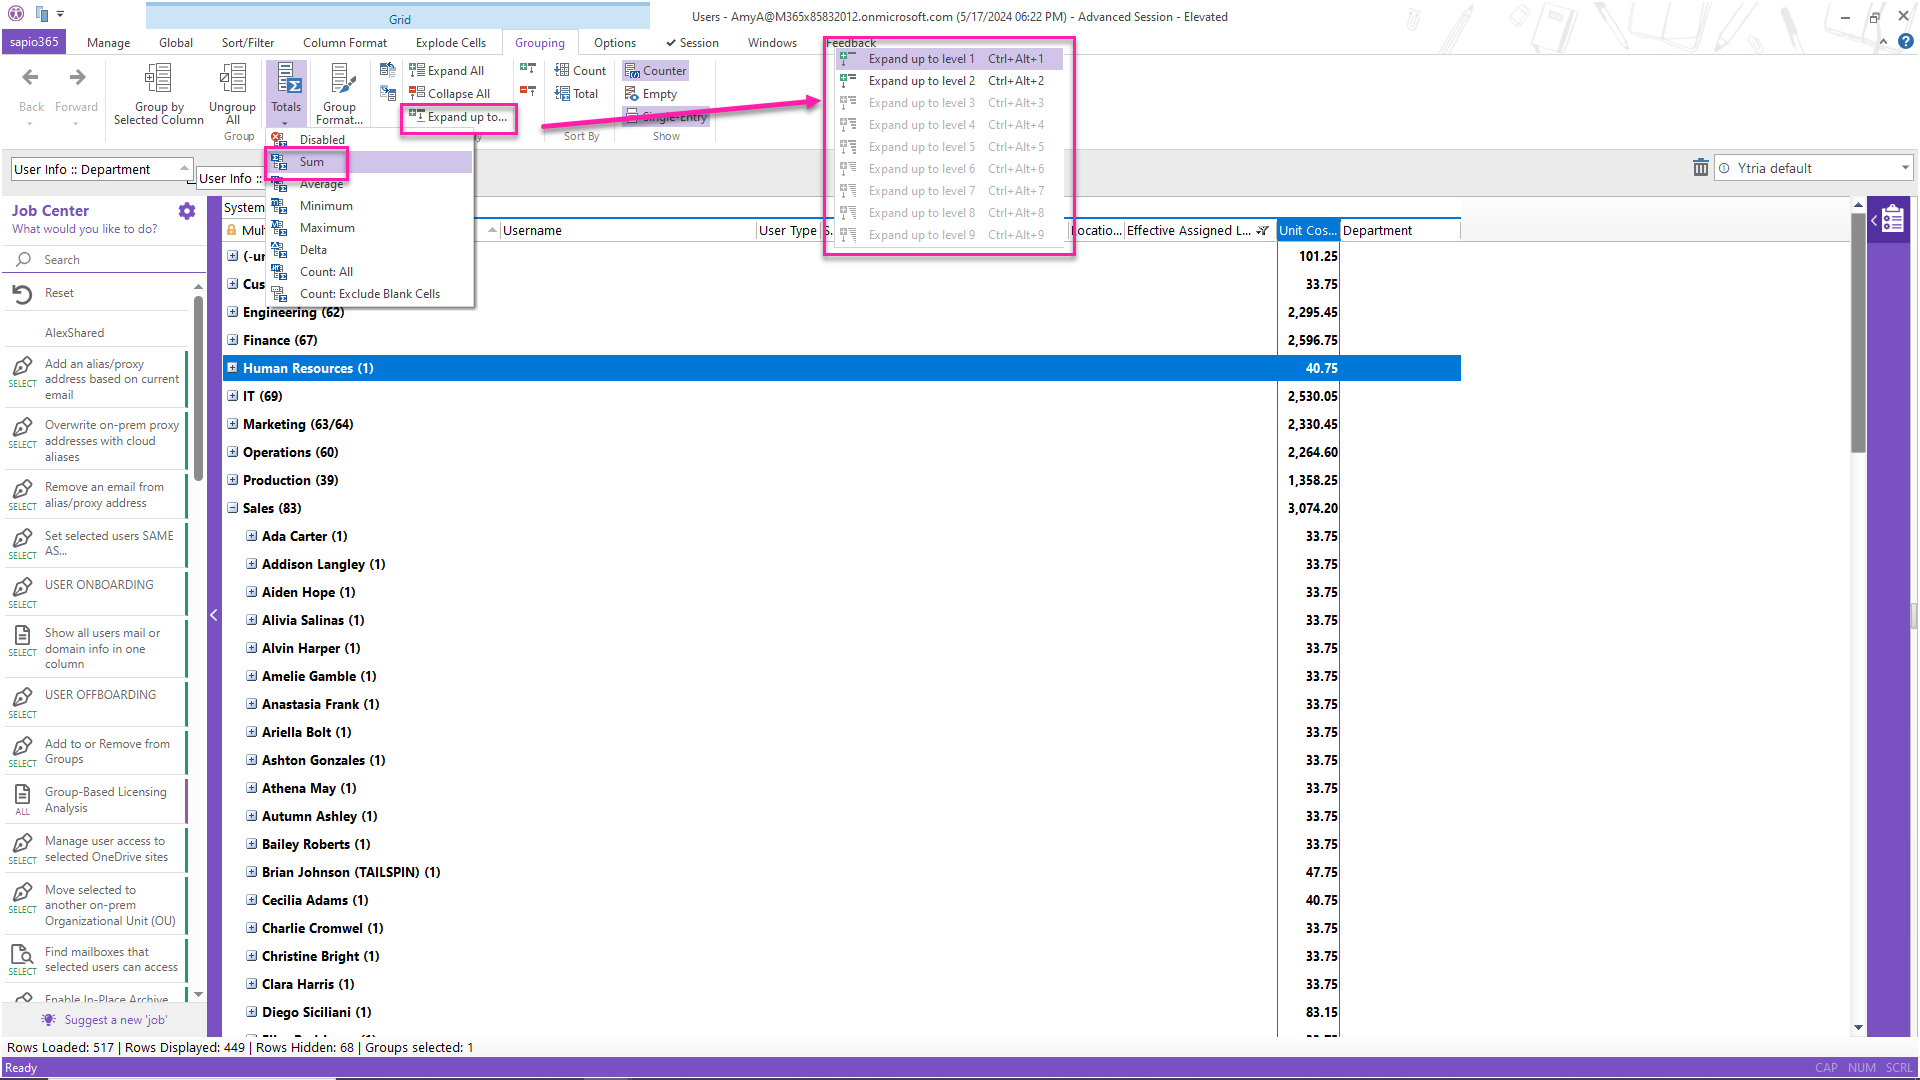
Next, you will add license totals for each category by selecting ‘Sum’ under Totals.
You can collapse all the categories, or you can expand only 1 level to include the license costs per user for a more detailed report.
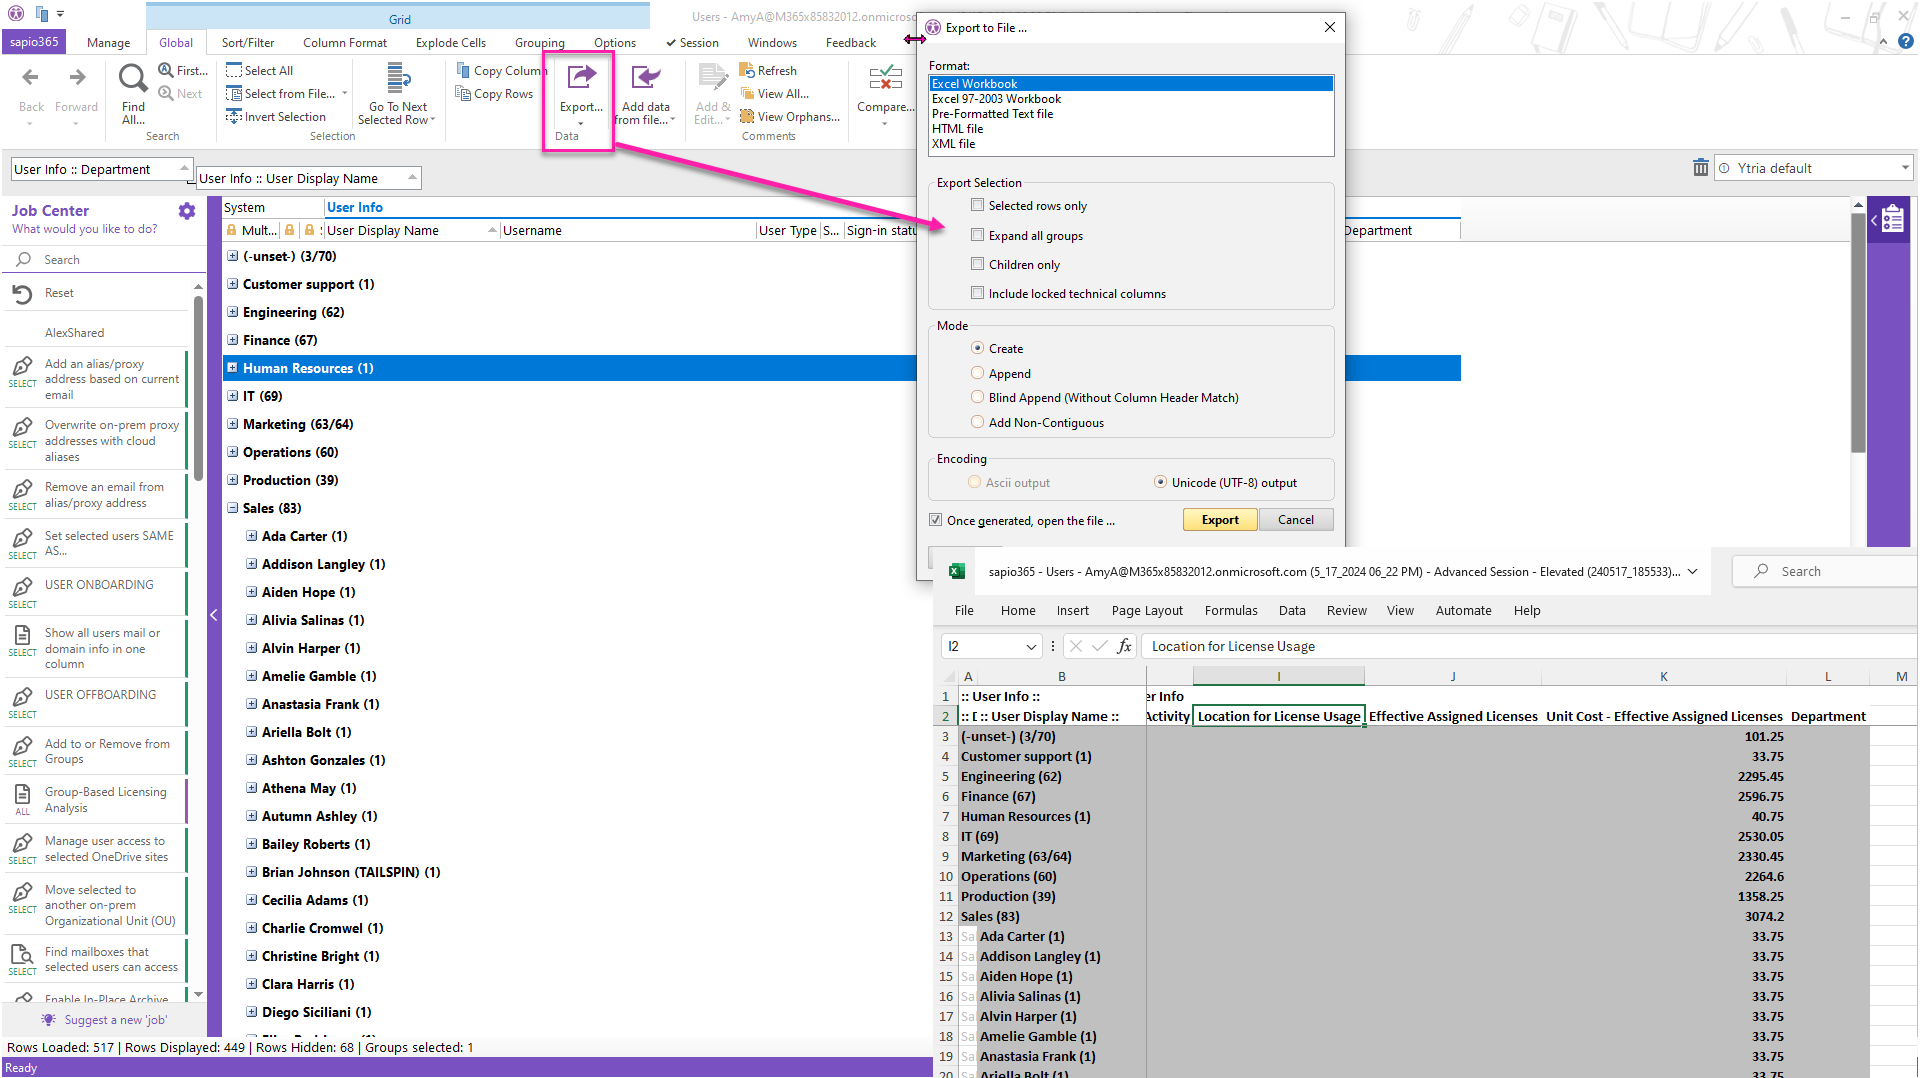
Now you can export the grid view to an Excel file.
sapio365 also allows you to save this grid view to apply it to your data at a later time, or you can schedule a report from it using one of sapio365’s many automated jobs. This will save you time further down the road if you think you will need to produce this report on a regular basis. Once you have your report, you may want to read more about how to audit Microsoft Office 365 license assignments here.
As you can see, there are a few ways to get your Microsoft Office 365 license cost report, but not all of them are easy, and some will take longer than others. sapio365 is a great software tool for customized reporting that is quick and easy to use, and the bonus is that you can use it to accomplish many other tasks just as quickly and easily. You can read how one customer saved a lot of money on licenses by identifying inactive and under-utilized licenses here.
Discover how using sapio365 to handle typical Microsoft 365 administration can save you hours of time every single day.
blog_sapio365



Submit a comment