Who’s signing into Office 365, from what location, and how often?
With so many employees working from home these days, it can be a challenge for IT departments to know what is going on with users signing in from all over the place.
For example, you may want to know who is signing into Office 365, from what location and how often. You’d also want to be able to reveal suspicious activity. Microsoft Office 365 has an impressive arsenal of tools to deal with external attacks. It even has a phishing simulation that you can “test” on your users. However, even with all these safeguards in place, user accounts can get hacked.
The good news is that you’ve got access to the Sign-in activity report in the Azure Active Directory portal. This handy report can help you identify potential attacks on your user accounts and other unusual sign-in activity. However, unless you suspect a specific user account, it’s a little difficult to see the big picture of who’s trying to sign in to your tenant and from where.
That’s where sapio365 can help. This great tool can help you retrieve all the information you need quickly, and helps you organize it in a way that makes sense to you.
Sign-in activity reports in the Azure Active Directory portal
Let’s start by looking at what the Sign-in activity report offers users.
You can change the time range (1), add or remove columns (2), and use filters (3) like we did here to see only sign-in failures.
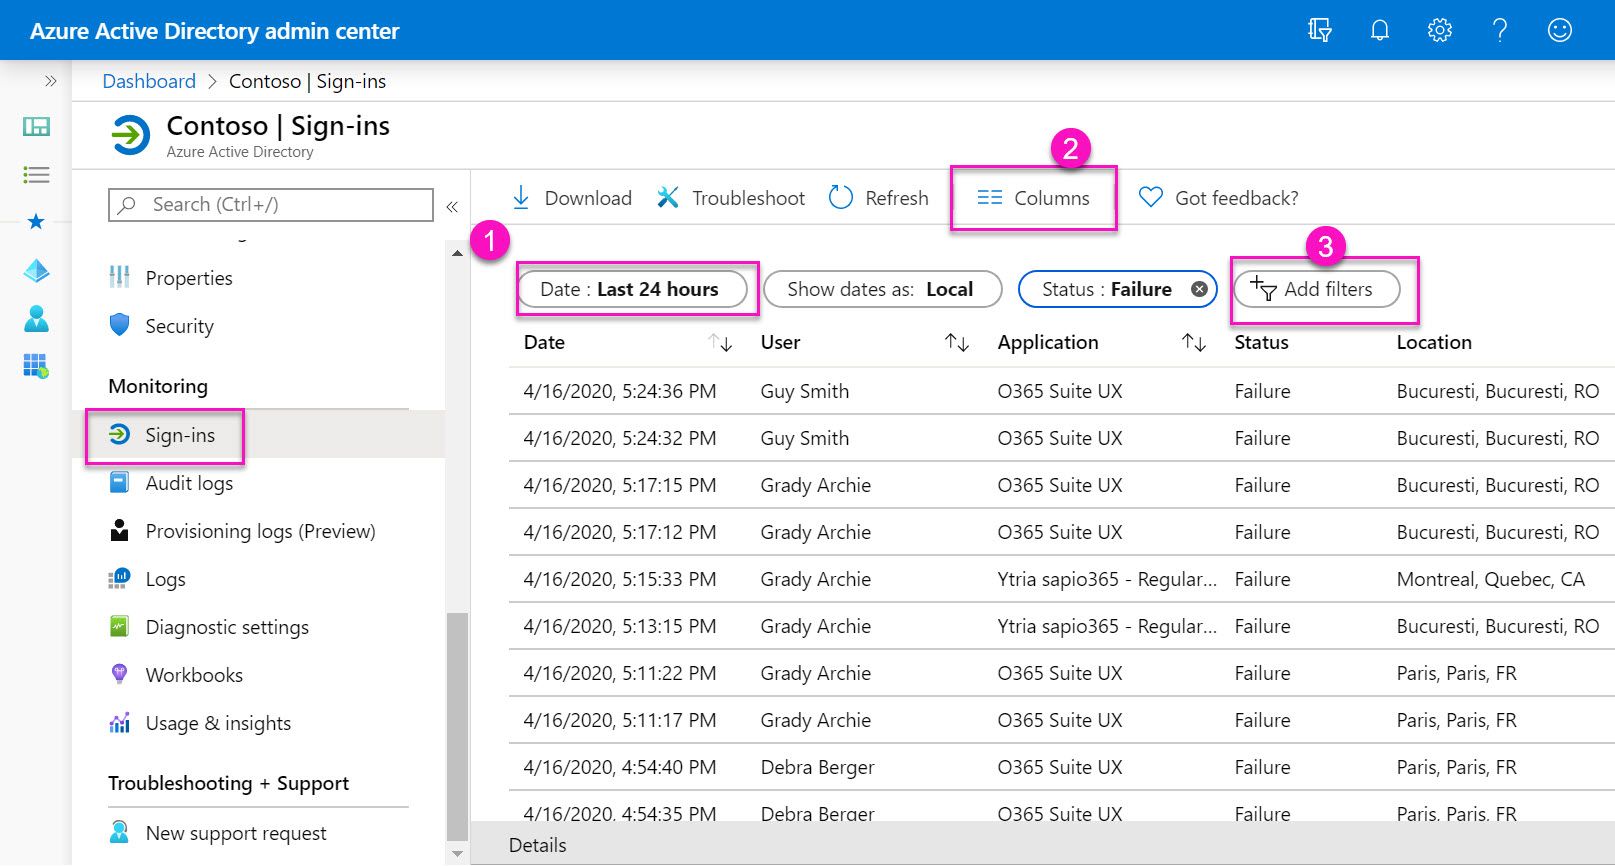
Select an entry and you’ll be able to see details about why that sign-in event failed. In this case, it was an invalid username or password.

If you have an Azure AD Premium P1 or P2 license, you can record 30 days of sign-in data. A free Azure AD license gets you 7 days. You can download the data for analysis, but you’re limited to 250,000 events through the portal.
Use sapio365 and see it all in one place
Although you have various filters available in the Office 365 portal, it’s hard to get a global view of what’s going on with your users signing in from all over the planet, especially in this age of remote work.
sapio365 gives you access to the same data but makes it really easy to get answers to various important questions like:
- Where are my users signing-in from?
- What locations are most associated to sign-in errors?
- Which user accounts are involved?
- And how often do these errors occur?
On the main sapio365 page, click on ‘Sign-in report’ and choose how many of the latest sign-ins you want to retrieve. If you have a lot of activity (active users), you may want to limit yourself to smaller increments.
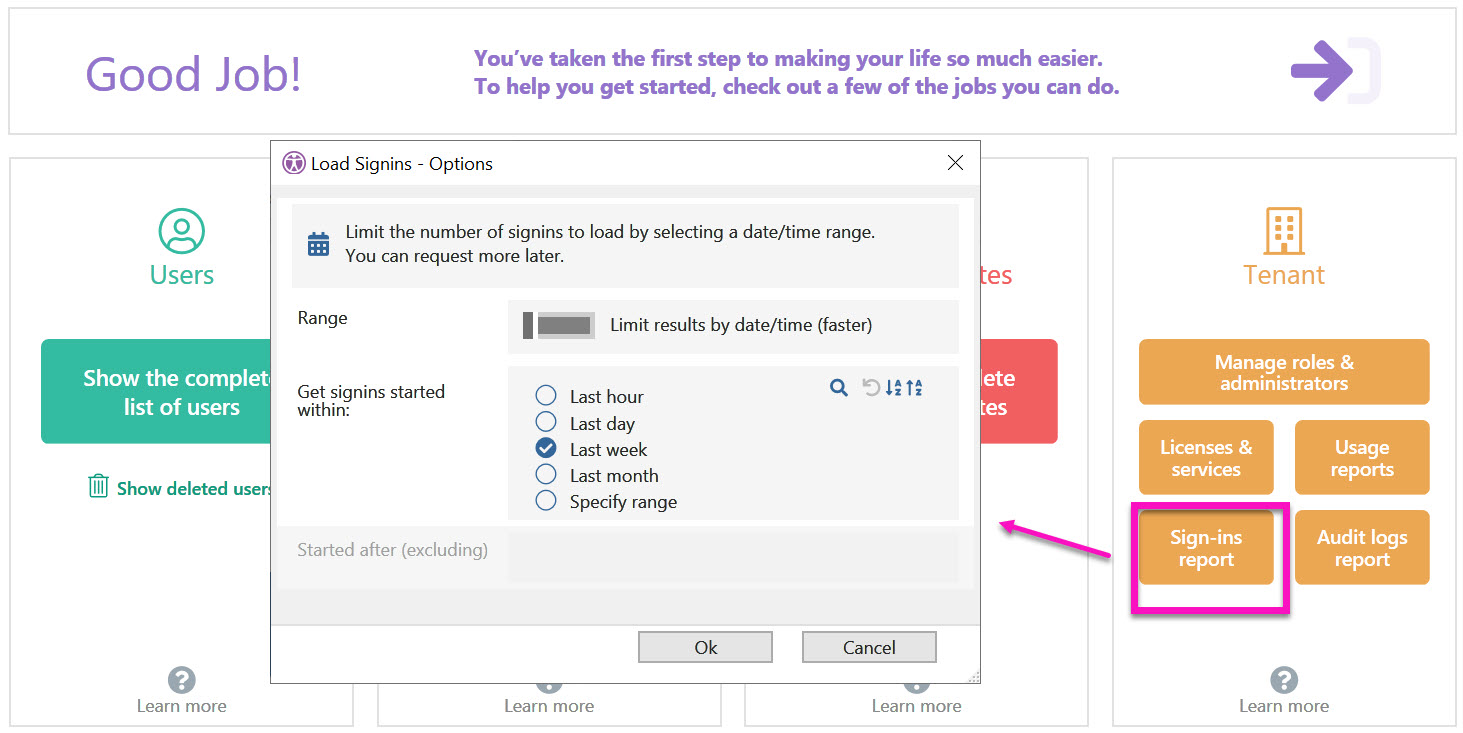
What you see are all the same entries as in the Office 365 portal.
However in the portal, in order to see them all, you have to scroll down to ‘load more’. Since sapio365 is a desktop application, it can handle a greater volume, and so you won’t need to ‘load more’.
Categorizing the information then helps to give you various views of your information. So just drag and drop the column titles ‘Status error’ & ‘City’ to explore successful versus failed attempts.
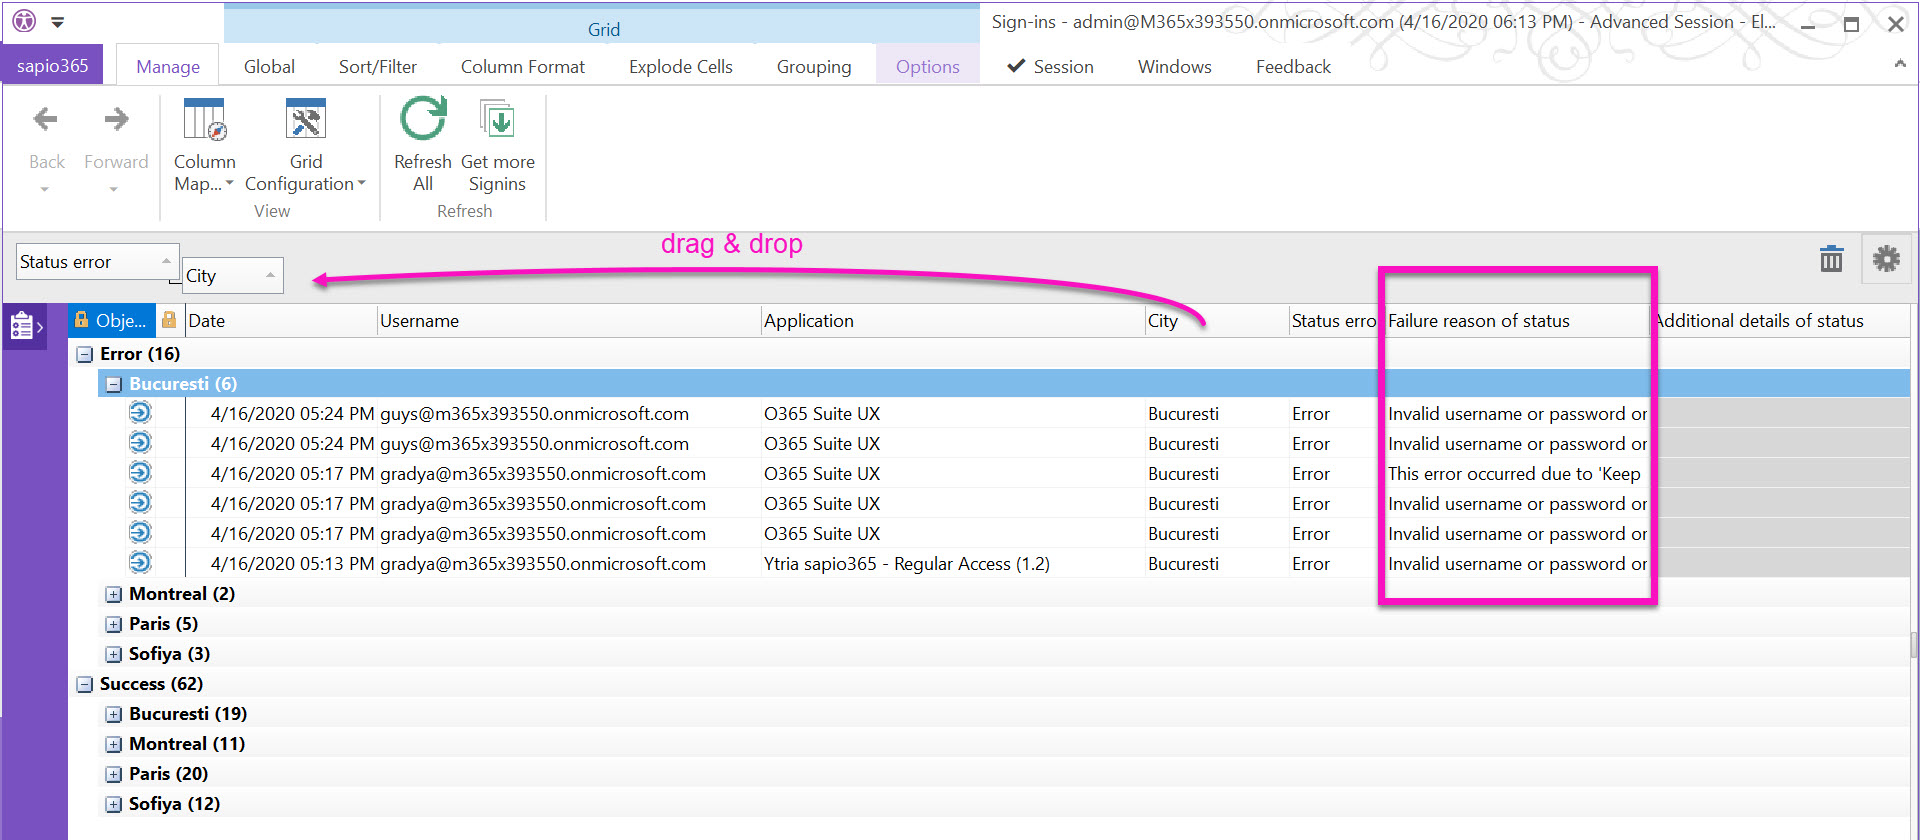
Interested only in errors? Then simply use a filter on that column:
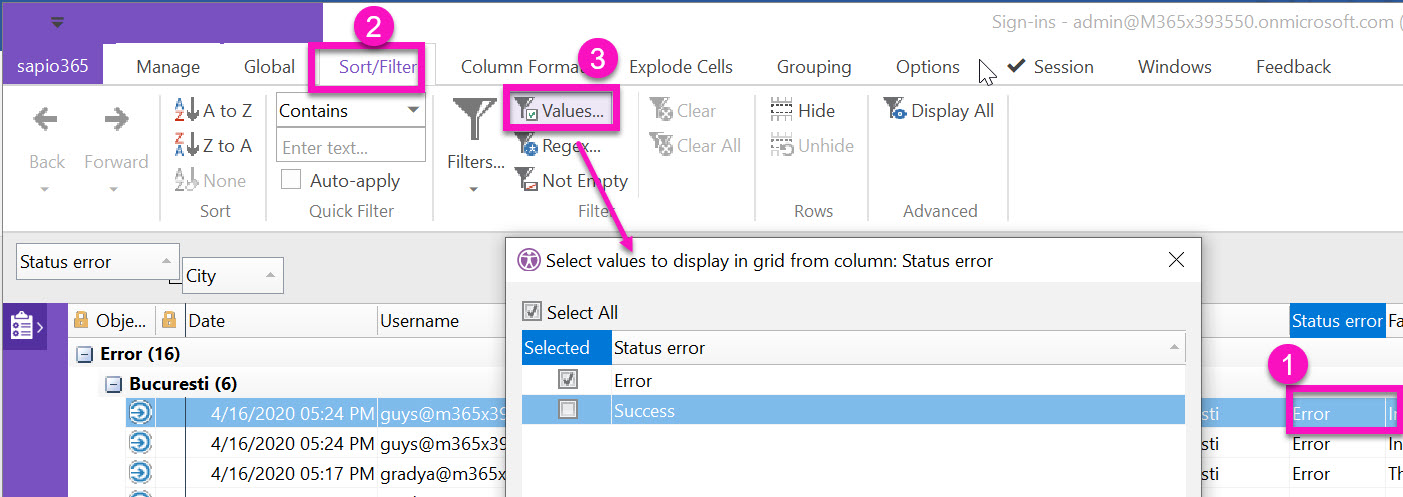
Select a cell in the “Status error” column (1), click on the Sort/Filter tab (2), and then Values (3). Clear the checkbox for ‘Success’.
Another fancy way to organize date-driven data, is by categorizing by the date and then changing the setting for that column grouping.
To do this, select a cell in the date column (1), click on ‘Group Format’ (2) and change the setting (3).
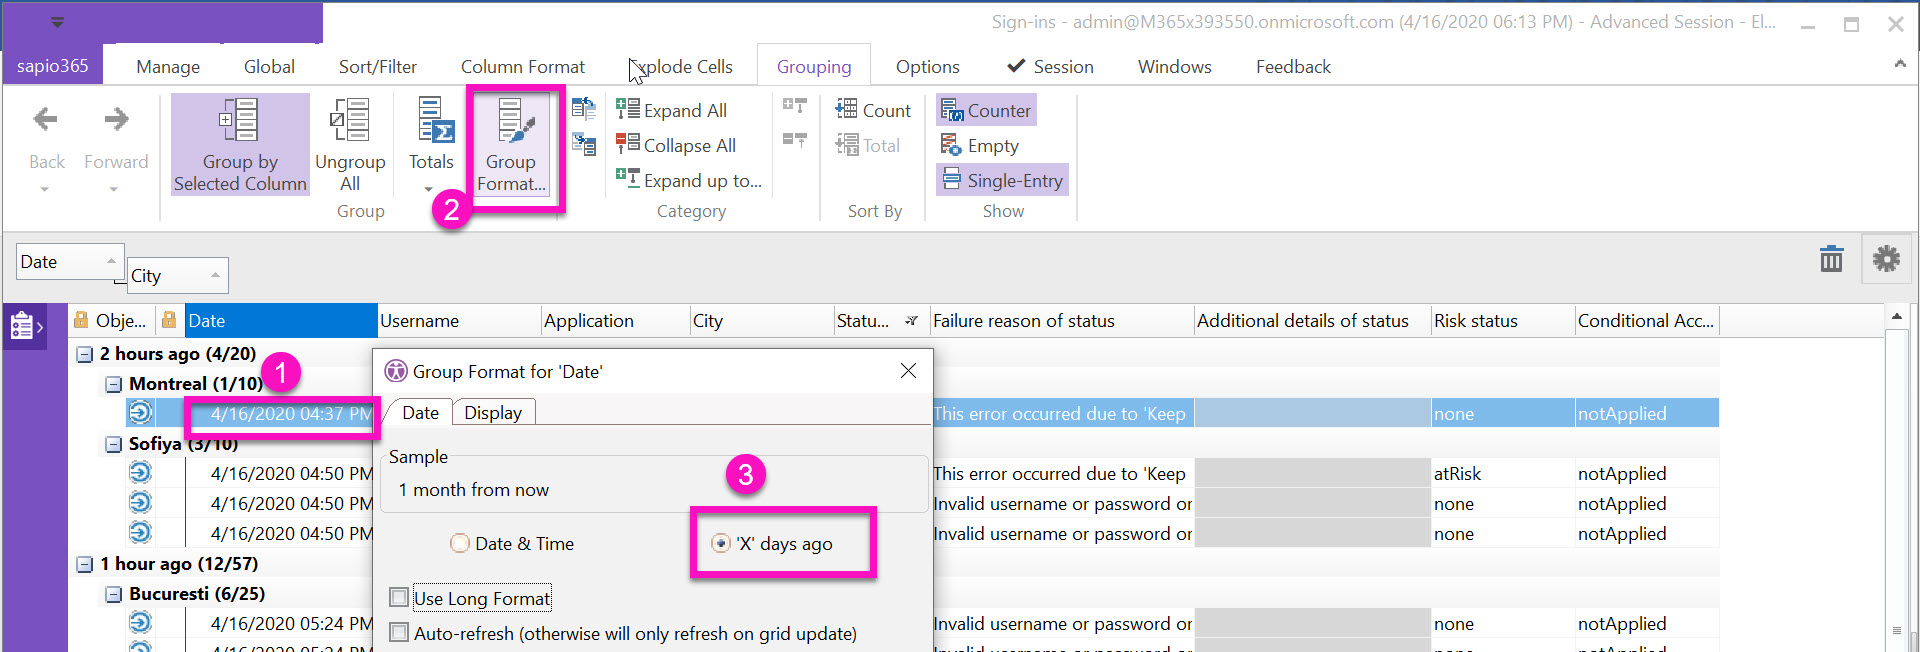
In the end, you get a nice picture of sign-in errors per city per period.
If you notice a large number of unsuccessful attempts in a city or for a specific user account, you know where to start investigating!
Get a weekly sign-in error report in your inbox
Since any action in sapio365 can be automated, we created a task that gives you this same result without you having to perform any manual actions. You can access it from our featured jobs….just follow the arrow! You’ll find other useful jobs there as well.
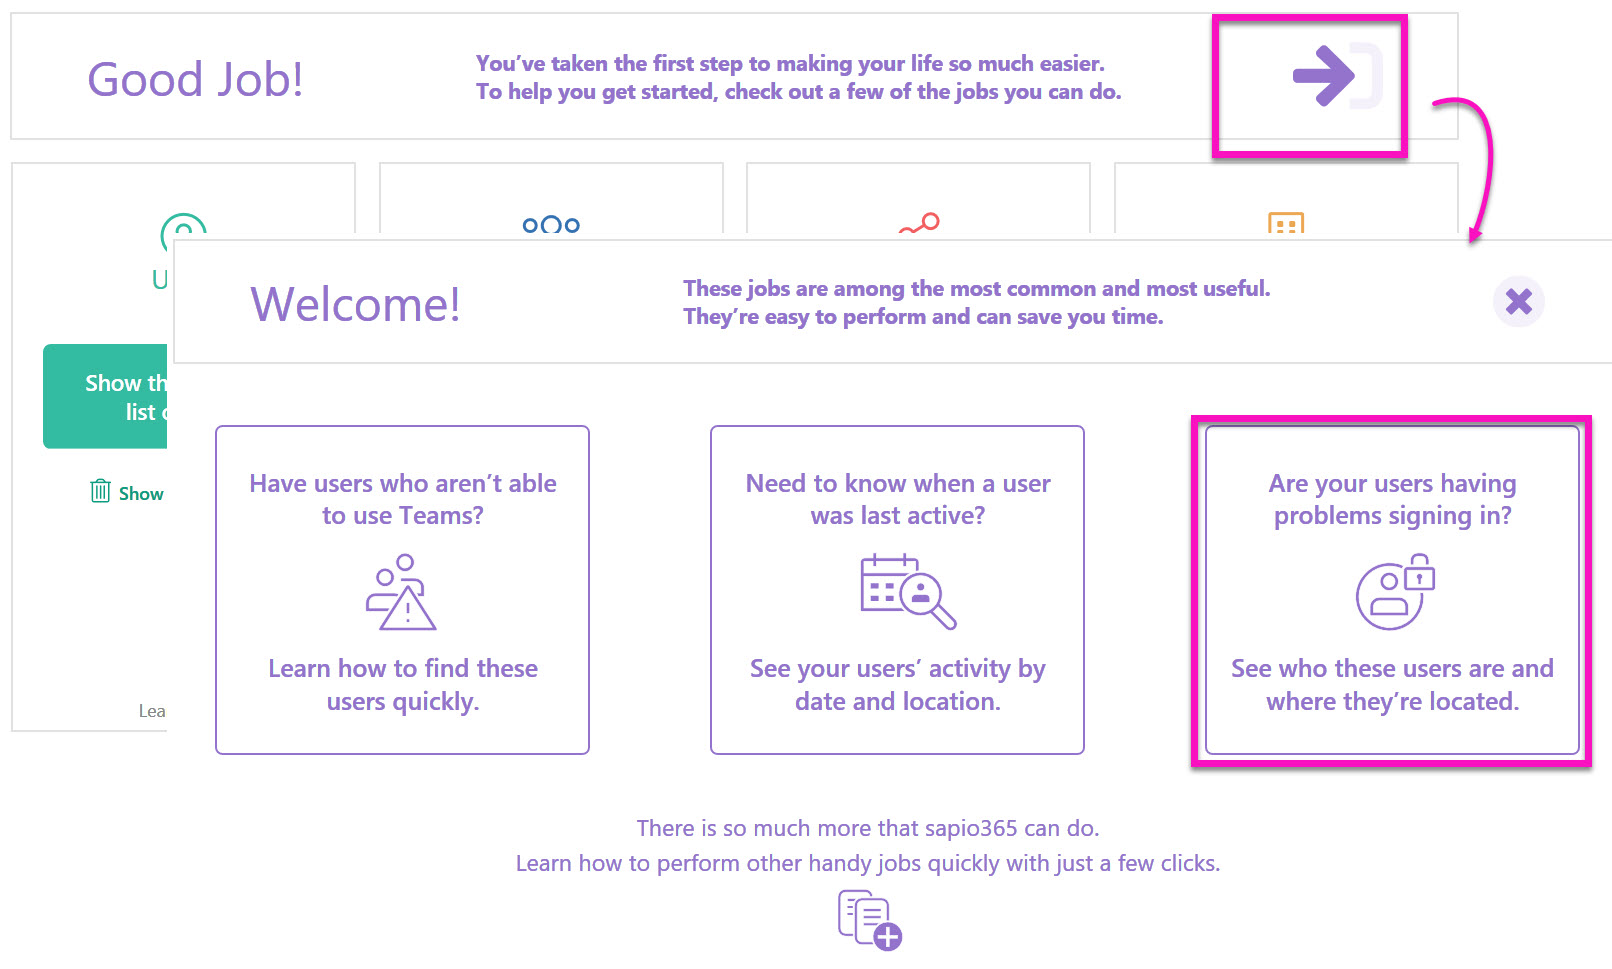
The bonus is that you can also schedule this job from within sapio365 to keep an eye on your users’ sign-in patterns. You’ll also have an option to receive the results in your inbox.
With just a few clicks in sapio365, you can resolve problems you may not even know you have. sapio365 is like your own personal genie in a bottle, allowing you to save time and get more done with just a few clicks – and no PowerShell scripts.
Check it out for yourself and see what you discover!

Submit a comment