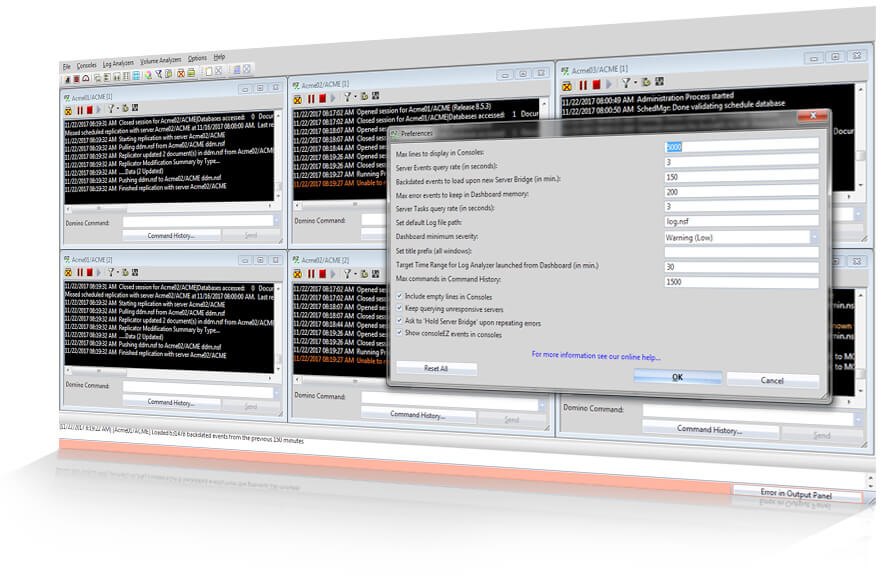
Keep a discerning eye on all your HCL Domino servers
Monitor multiple server consoles at once, customize the event output, and report everything that you see, so you can finally hear everything your servers are telling you.

Monitor a virtually unlimited number of HCL Domino servers, simultaneously, all in one place
consoleEZ is a robust console monitoring tool that gives you total visibility over your server events by offering virtually unlimited simultaneous consoles, each customizable to only show the events that you choose, and a live, central event dashboard.
Real-time, custom overview of activity for multiple HCL Notes servers
consoleEZ gives you virtually limitless options for observing server activity—open as many server consoles as you’d like and view them all in one central interface. What’s more, you can customize the display of your consoles to help pinpoint specific event severity levels, or events containing certain strings in their names, or even employ many built-in tools for deeper analysis.
- Open as many server consoles as you’d like and view them all in one central interface.
- Filter server consoles to only display the events you are interested in.
- Isolate server events based on severity level or background/foreground event type.
- Use regex to only show events that meet certain text output criteria such as process name, event name, or user name.
Choose what type of events to display in your console windows.

Use Case #24
Choose what type of events to display in your console windows.
In larger environments, the sheer amount of information shown in a given console can be overwhelming. Use consoleEZ's console filters to cut through the clutter and display only the information that you need to see.
Turn your console into a to-do list. Show only errors of the severity level you choose.

Use Case #16
Turn your console into a to-do list. Show only errors of the severity level you choose.
When you're looking to address the important problems first, it's critical to see the higher-level errors. With consoleEZ, you can set console output to display errors of the severity level you choose.
Apply a Regular Expression filter to show, or hide, certain events.

Use Case #31
Apply a Regular Expression filter to show, or hide, certain events.
Because consoleEZ lets you open multiple consoles to the same server, you can easily use regular expression filters to customize output, tailoring the consoles readout to only show a particular event, process name, string, or even user name.
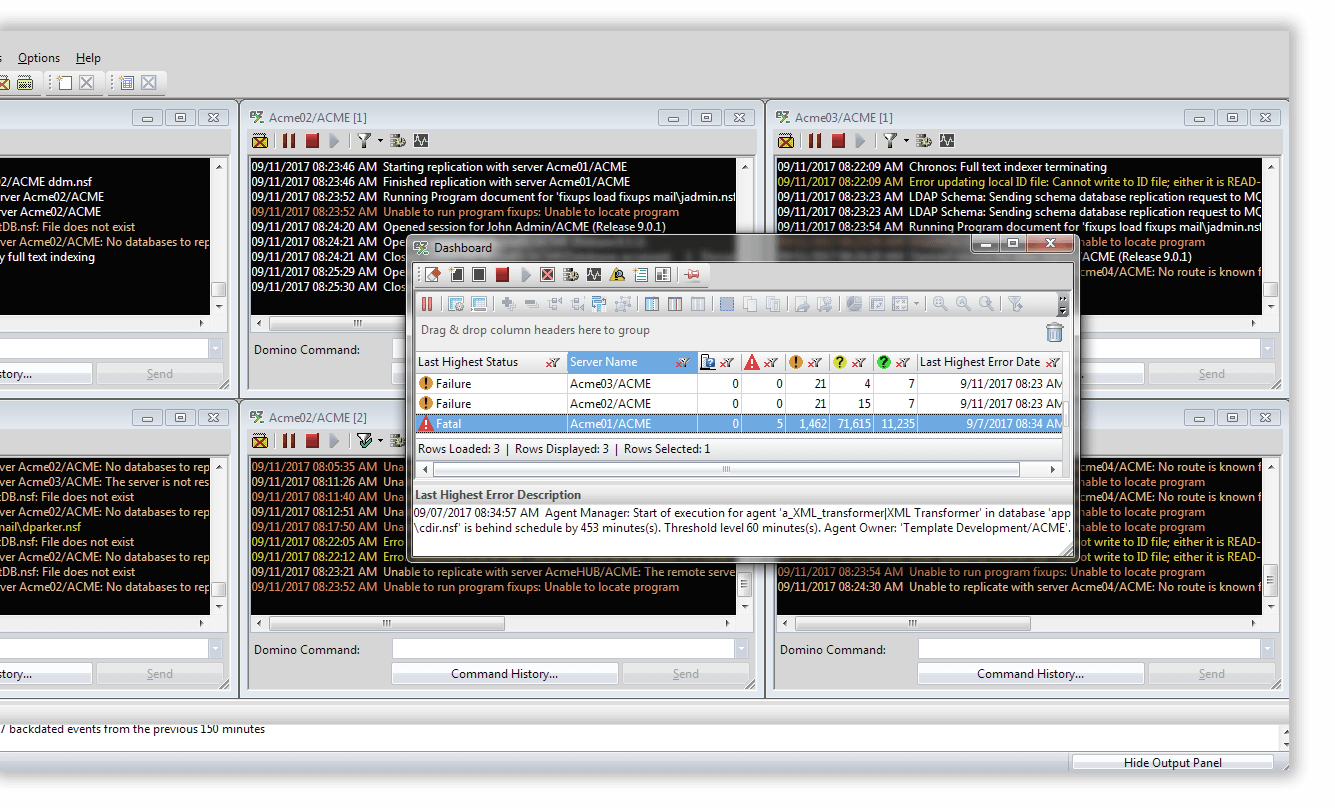
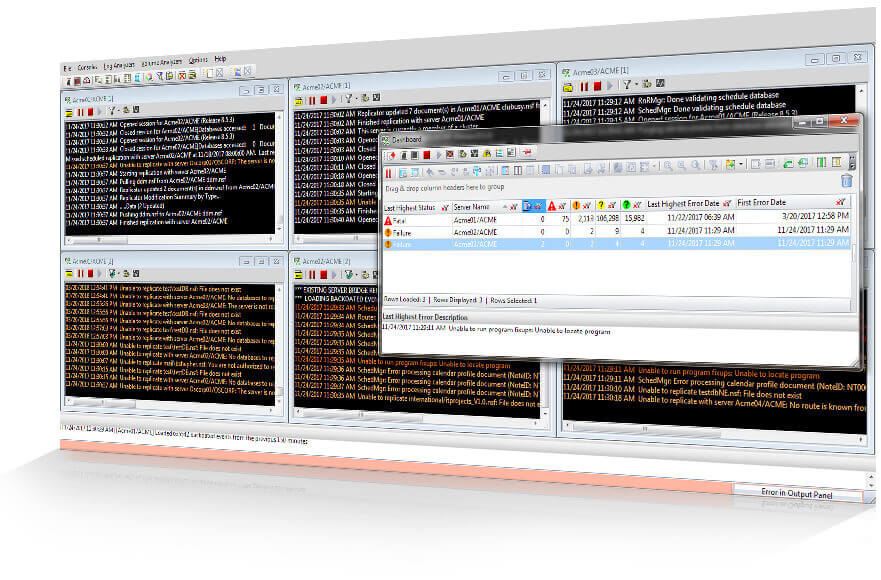
- Get a fast, global vision of errors across multiple servers— as they occur in real time.
- See errors all at once, without having to search through console histories.
- See all errors, across all opened server consoles, broken down by category: Servers not responding, Fatal errors
Failures, Last-error dates and more…
Keep an eye on your servers at all times.

Use Case #22
Keep an eye on your servers at all times.
Keep track of any errors across all servers throughout a given session through consoleEZ's live dashboard. Drill down to detailed info such as individual consoles a given console, or further explore a server log file, in just one click.
- See all server tasks and all server statistics for the duration of each of your console sessions in dedicated tools (one for tasks and one for statistics).
- Everything is displayed in a flexYview interface, where you can categorize and filter your data however you choose.
- Craft quick reports of any data within the grid in only a few clicks.
Monitor your servers better through advanced console windows.

Use Case #30
Monitor your servers better through advanced console windows.
Keep an eye on your servers at all times in dynamic console windows that constantly refresh. You never need to open your native server console.
Compile, analyze, and report server statistics quickly and easily.

Use Case #17
Compile, analyze, and report server statistics quickly and easily.
Because you get all your statistics in the same interface, it's simple to copy/paste or export it all to a spreadsheet for further analysis or for reporting purposes.
- Send console commands to any number of servers at once—see their responses live in the console interface.
- Store any previously composed commands for easy recall. Choose from a list of previously sent commands.
consoleEZ makes sending console commands easy.

Use Case #25
consoleEZ makes sending console commands easy.
Have you ever needed to re-use a complex console command you sent off in the past (for example, a fixup –Q –V on app\crm\crminstancedb_12) on another database? By storing all previous commands in a command history, and supporting type-ahead search, consoleEZ makes sending complex commands quick and easy.
Complete analysis tool for HCL Domino server log files
Opening an HCL Domino server in databaseEZ gives you a multi-level approach to analysis. Using the concept of “tiered loading” you’ll be able to see basic, key properties directly upon launch and then load an array of progressively deeper attributes in only a few more clicks—seeing all of this information in a central, feature-rich display.
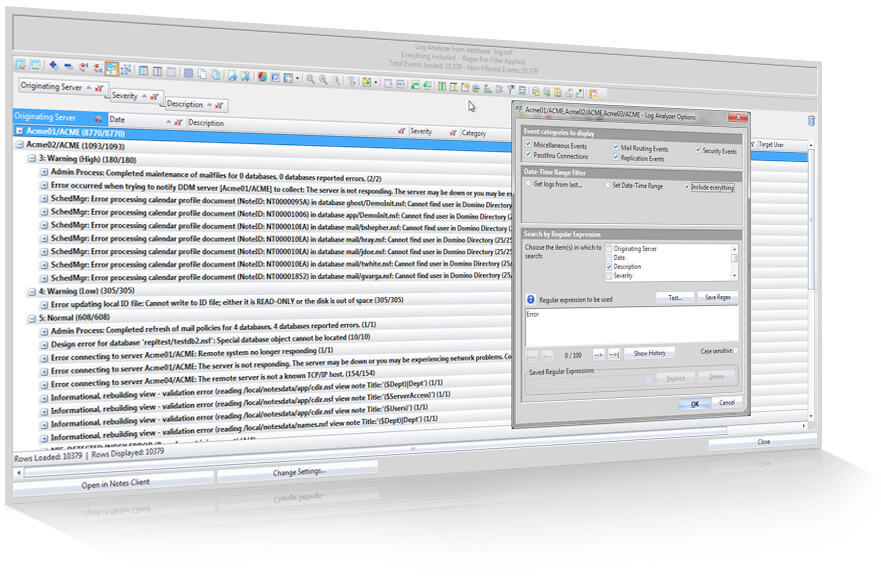
- Search and analyze your log.nsf data to easily pinpoint the events you need to see.
- Perform detailed searches of the log files for multiple servers at once.
- Isolate events by categories such as passthru connections, replication events, security events, and more.
- See events based on a specific date-time range, from a given cutoff time period, or include everything.
- Sort, filter, and categorize your results thanks to the flexYview-enabled results panel.
Search log.nsf based on event type, date/time range, Regular Expressions, and more.

Use Case #14
Search log.nsf based on event type, date/time range, Regular Expressions, and more.
Isolate event types and combine filters for accurate results for any log.nsf search thanks to the built-in Log Analyzer module. Hone search results to a specific date/time range, use Regular Expressions, and more.
Make use of the built-in interface capabilities for better understanding of results.

Use Case #37
Make use of the built-in interface capabilities for better understanding of results.
Categorize and report your log.nsf analyses quickly and easily thanks to the powerful flexYview-enabled results interface.
Complete server-volume analysis tools
Get a full overview of global data usage, as well as replication and passthru session volume, for multiple servers at once. With consoleEZ’s volume analyzer, you can scan multiple servers for detailed information regarding usage including user name, database accessed, number of transactions, and much more, all in a FlexyView-enabled interface where you can quickly organize your data based on any number of different criteria.
- Search usage data based on various filters and analyze the results in the powerful flexyView.
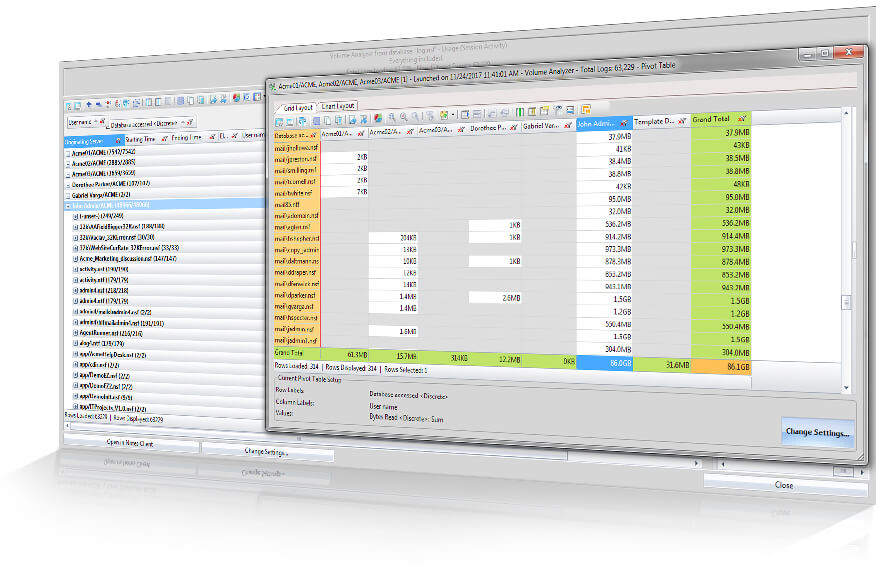
- All new Pivot table capabilities allow you to create extensive reports and view information like grand total of data usage per application, or a detailed breakdown of what your users have been up to.
Get meaningful data aggregations through the built-in pivot table creator.

Use Case #12
Get meaningful data aggregations through the built-in pivot table creator.
This pivot table shows usage activity broken down into users and databases showing the bandwidth each user has been using per database.
- Analyze replication volume to understand how your bandwidth is being used.
- Gather and display information on what databases have been replicating and how frequently, the amount of bytes sent and received, the number of updates, additions and deletions made, etc.
Get meaningful data aggregations through the built-in pivot table creator.

Use Case #21
Get meaningful data aggregations through the built-in pivot table creator.
This pivot table shows the grand total of bytes sent and received, broken down into the Initiator and Receiver servers. It could be further customized to show databases, elapsed time, initiated by and other information as well.
Evaluate passthru connections to get a big picture of:
- The number of bytes sent and received
- The number of documents read and written
- The duration of sessions
Get meaningful data aggregations through the built-in pivot table creator.

Use Case #26
Get meaningful data aggregations through the built-in pivot table creator.
This example shows a pivot table with passthru events broken down into users and destination servers.
Beyond the tools: reporting, integration, and automation
consoleEZ offers a virtually unlimited amount of tailored console output. So it’s a good thing that built right into the tool are easy ways to report on that information.
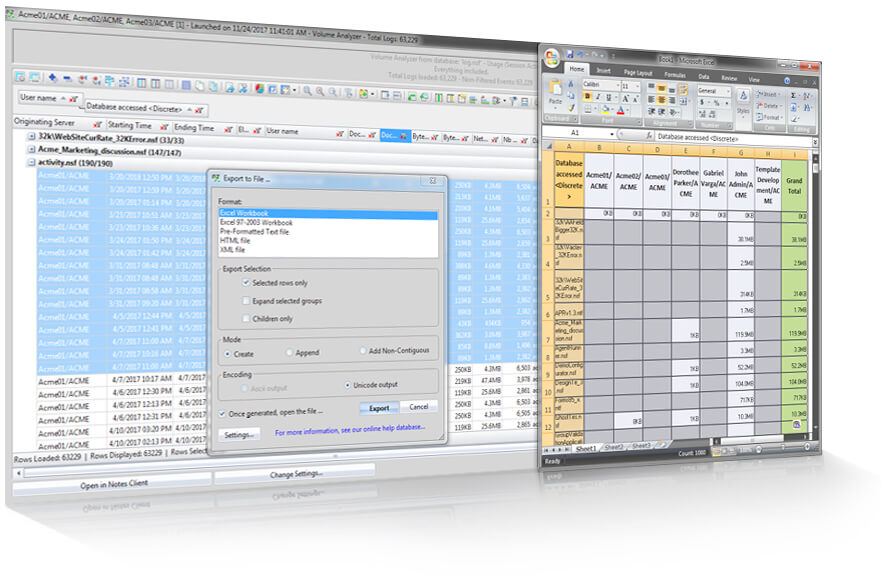
The FlexyView is the core engine of all Ytria tools, and all information in any panel is directly available to copy/paste, or to easily export to a variety of output formats. What’s more, if you can do it in the UI, then you can also integrate it into a powerful automation script.
Export data quickly and directly from any consoleEZ grid. Create reports in HTML, Excel, XML, and CSV, or simply copy/paste your data, including output text from consoles.
Extend consoleEZ’s scope through your own scripts that let you repeat functions across an even larger scale. You can even use the command line integration to create push-button, multi-step process launchers.
Leverage built-in bridges between products to open the server you’re working on in other EZ Suite tools directly from within consoleEZ, open log files in your Notes client, and more.
Local installation, far-reaching power
Installed on the client side only, consoleEZ is completely independent from your Notes client. Because of this, consoleEZ offers you power and independence that just isn’t possible with any native solution.
consoleEZ is a standalone compiled application coded in an efficient, low-level language. When installed, its executable file (consoleEZ.exe) is detached into your Notes Program Directory. Each time you start consoleEZ, a new Notes session is created, independent from your Notes client session. consoleEZ runs parallel to your Notes and Designer clients and thus will not interfere in any way. In fact, you can think of consoleEZ as a special “Admin client” that will let you oversee a virtually unlimited number of server consoles at once. You can even select which ID you want to work with—without having to switch IDs in your native clients!
This means it won’t tie up your IBM Notes or Admin client, or your console. You can even select which ID file to work with – without having to switch IDs in your native clients!
Like all other Ytria tools, consoleEZ is installed on the client side ONLY—server-level functionality, local install. There is no need to install anything on the server, and being a local install means no system downtime.
consoleEZ offers you a multitude of features that surpass the functionality available in the native clients but our tools NEVER bypass Notes security. Importantly, we separate “viewing” and “talking to” servers. Proper access rights are essential to be able to send server commands. Otherwise consoleEZ only permits viewing server actions—this alone is a huge benefit sure to the sheer number or possibilities available through customizing the console output filters. A perfect way for developers to get server event visibility without needing any special access rights. Full Access Administration is also possible, with the proper access.
The fact that consoleEZ is an independent, compiled program puts it in the position to outperform the Admin client or agents coded in LotusScript. But beyond that, consoleEZ gives you unmatched speed and flexibility in viewing log documents through the built in Log Analyzer. You can parse log file information and view it all in a flexible grid interface for better clarity as well as the ability to search specific information and report your results quickly and easily.
